Connect Webflow and Image-Charts to power AI-driven automation
- No-code AI automation
- Full audit trails and controls
- SOC 2 and GDPR compliant
- Easy visual workflow builder
- 9,000+ apps, 450+ AI tools
- Free tier available
How Zapier works
Zapier makes it easy to integrate Webflow with Image-Charts - no code necessary. See how you can get setup in minutes.
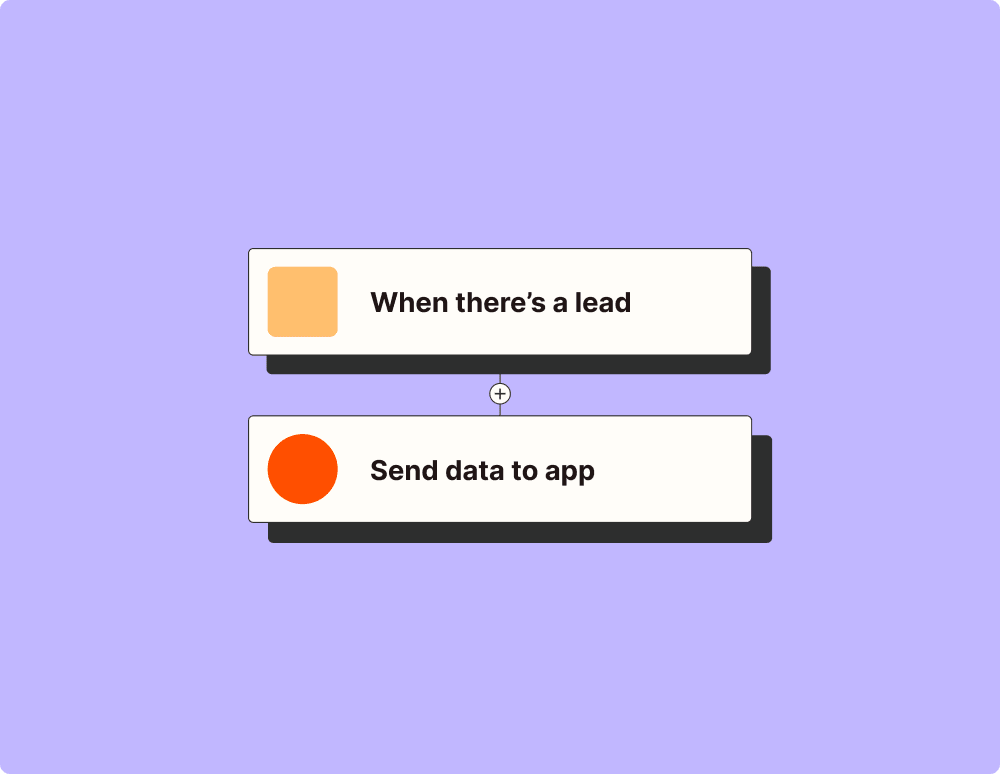
Choose a trigger
A trigger is the event that starts your Zap—like a "New Form Submission" from Webflow.
Add your action
An action happens after the trigger—such as "Create a Bar Chart" in Image-Charts.
You’re connected!
Zapier seamlessly connects Webflow and Image-Charts, automating your workflow.
Supported triggers and actions
Zapier helps you create workflows that connect your apps to automate repetitive tasks. A trigger is an event that starts a workflow, and an action is an event a Zap performs.
- Help_text
- SiteRequired
- FormRequired
Try ItTriggerInstant- SiteRequired
Try ItTriggerInstant- SiteRequired
Try ItTriggerInstant- SiteRequired
- CollectionRequired
- Is Draft
ActionWrite
- SiteRequired
Try ItTriggerInstant- SiteRequired
Try ItTriggerPolling- SiteRequired
- CollectionRequired
- Is Draft
ActionWrite- SiteRequired
- OrderRequired
- Send Order Fulfilled EmailRequired
ActionWrite
For AI agents & developers
Use Webflow and Image-Charts with AI agents and code
Beyond Zap workflows. Call Webflow and Image-Charts actions directly from your AI client or your codebase, using the same 9,000+ app integrations Zapier already runs.
Connect via Zapier MCP
Expose Webflow and Image-Charts actions as tools in any MCP client. Authenticate once, then call them in natural language.
Example actions on this page
Works with
Claude · ChatGPT · Cursor · any MCP-compatible client
Call from code with the Zapier SDK
Trigger Webflow and Image-Charts actions from backend services, scripts, or agent code.
Install
# TypeScript / Node
npm install @zapier/zapier-sdk
Run an action
import { createZapierSdk } from '@zapier/zapier-sdk';

const zapier = createZapierSdk();
await zapier.runAction({ /* webflow / image-charts action */ });There is no Python package yet. SDK is TypeScript-only (@zapier/zapier-sdk). The MCP server URL is personal to your account; get it at zapier.com/mcp.
Zapier is the automation platform of choice for 87% of Forbes Cloud 100 companies in 2023


93%
Customers who say using Zapier has made them better at their job
25m
Customers have created over 25 million Zaps on the platform
6 mins
The average user takes less than 6 minutes to set up a Zap
Connect Webflow and Image-Charts to integrate crucial parts of your business
With Zapier, you can integrate everything from basic data entry to end-to-end processes. Here are some of the business-critical workflows that people automate with Zapier.
Automate your lead management and improve conversions
Create more impactful campaigns with automation

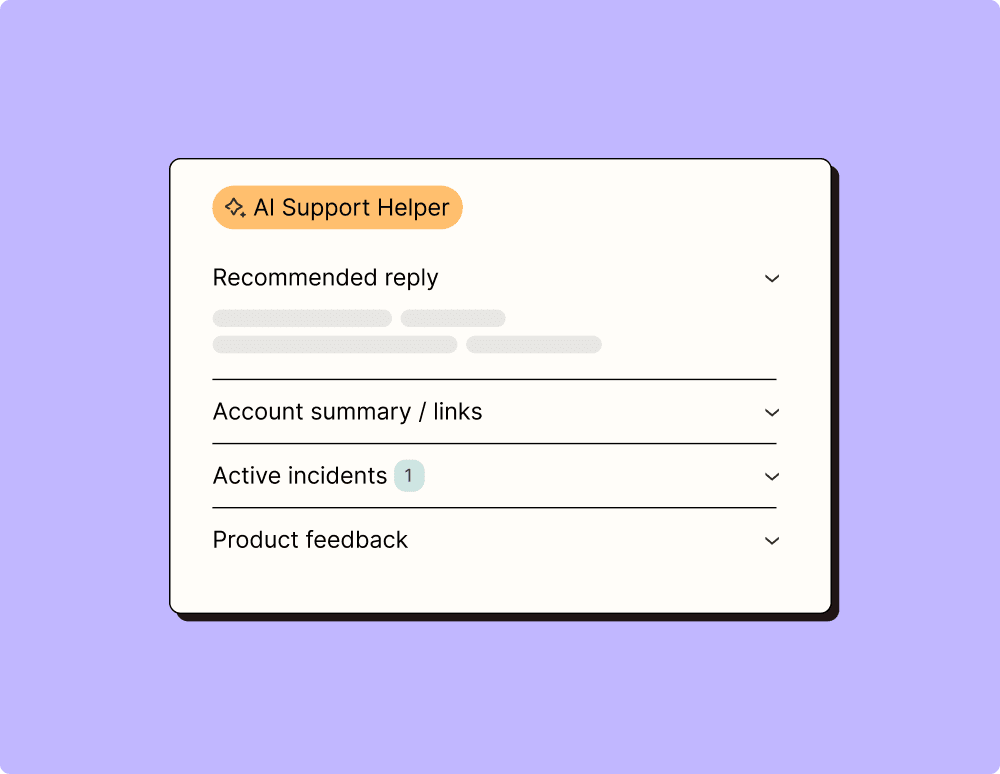
Provide world-class support with a little help from automation
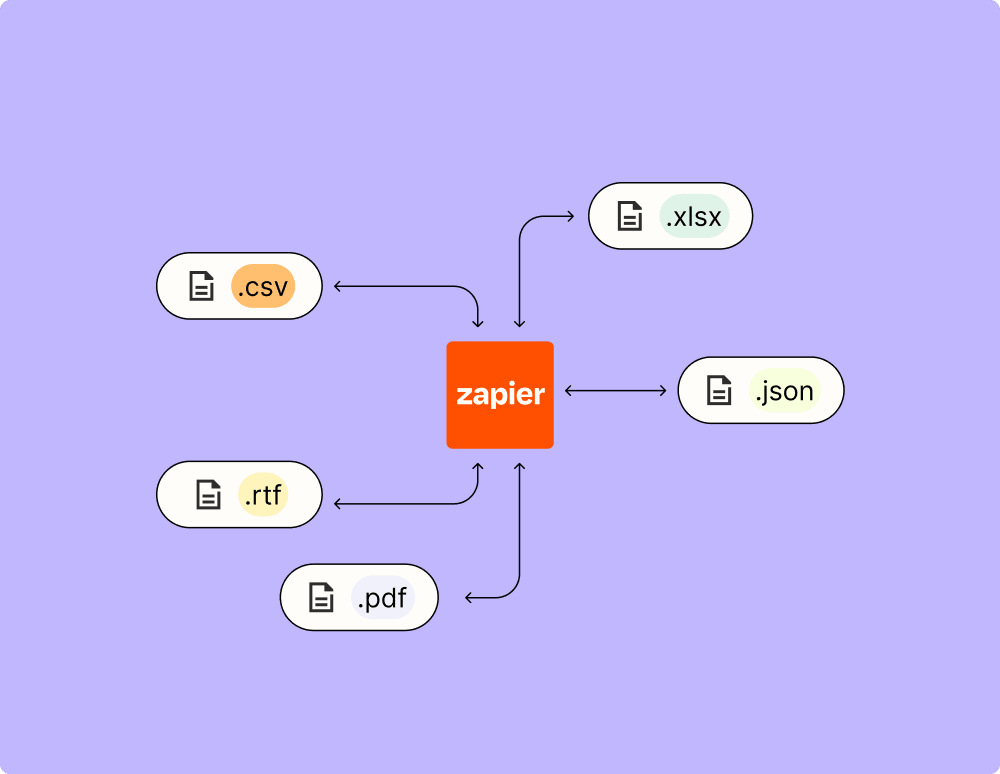
Automate your way to actionable, up-to-date data
Resolve incidents faster with automation
Learn how to automate Webflow on the Zapier blog
Make work flow with AI