Top companies trust Zapier to automate work that solves their unique business problems—no coding required.
How Zapier works
Zapier makes it easy to integrate Google Sheets with Image-Charts - no code necessary. See how you can get setup in minutes.
100%
Help
Google Sheets
Google Sheets
1. Choose trigger event
Image-Charts
Image-Charts
2. Choose action
1. Select the event
Setup
Test
Google Sheets
Choose a trigger event
Choose a trigger
A trigger is the event that starts your Zap—like a "New Spreadsheet Row (Team Drive)" from Google Sheets.
Add your action
An action happens after the trigger—such as "Create a Bar Chart" in Image-Charts.
You’re connected!
Zapier seamlessly connects Google Sheets and Image-Charts, automating your workflow.
Supported triggers and actions
Zapier helps you create workflows that connect your apps to automate repetitive tasks. A trigger is an event that starts a workflow, and an action is an event a Zap performs.
Create a new record or update an existing record in your app.
Drive
Spreadsheet
Required
Worksheet
Required
Action
This is an event a Zap performs.
Write
Create a new record or update an existing record in your app.
Drive
Spreadsheet
Required
Worksheet
Required
Frozen Rows Count
Frozen Columns Count
Sheet Position
Hide Sheet
Action
This is an event a Zap performs.
Write
Create a new record or update an existing record in your app.
Drive
Spreadsheet
Required
Worksheet
Required
Source Range
Required
Destination Range
Required
Paste Type
Action
This is an event a Zap performs.
Write
Create a new record or update an existing record in your app.
Drive
Title
Required
Spreadsheet to Copy
Headers
Action
This is an event a Zap performs.
Write
Create a new record or update an existing record in your app.
Info
Drive
Spreadsheet
Required
Worksheet
Required
Row(s)
Required
Action
This is an event a Zap performs.
Write
Create a new record or update an existing record in your app.
Info
Drive
Spreadsheet
Required
Worksheet
Required
Row(s)
Required
Action
This is an event a Zap performs.
Write
Create a new record or update an existing record in your app.
Drive
Spreadsheet
Required
Worksheet
Required
Row
Required
Background Color
Text Color
Bold
Italic
Strikethrough
Action
This is an event a Zap performs.
Write
Create a new record or update an existing record in your app.
Drive
Spreadsheet
Required
Worksheet
Required
Cell Range
Required
Validation Type
Required
Input Message
Strict Validation
Action
This is an event a Zap performs.
Write
Create a new record or update an existing record in your app.
Drive
Spreadsheet
Required
Worksheet
Required
Row
Required
Overwrite All Columns
Background Color
Text Color
Bold
Italic
Strikethrough
Action
This is an event a Zap performs.
Write
Create a new record or update an existing record in your app.
Api_docs_info
Stop on error
Required
HTTP Method
Required
URL
Required
Query string parameters
Additional request headers
Body
Action
This is an event a Zap performs.
Write
Create a new record or update an existing record in your app.
Drive
Spreadsheet Name
Required
Search Type
Action
This is an event a Zap performs.
Search
Find existing data in your app
Drive
Spreadsheet
Required
Worksheet
Required
A1 Range
Required
Action
This is an event a Zap performs.
Search
Find existing data in your app
Drive
Spreadsheet
Required
Worksheet
Required
Row ID
Required
Action
This is an event a Zap performs.
Search
Find existing data in your app
Drive
Spreadsheet
Required
Worksheet
Required
Lookup column
Required
Lookup value
Required
Supporting lookup column
Supporting lookup value
Search from last row
Row count
Action
This is an event a Zap performs.
Search
Find existing data in your app
Drive
Spreadsheet
Required
Title
Required
Overwrite existing worksheet with the same title
Headers
Action
This is an event a Zap performs.
Search or write
Find existing data in your app, or create a new record if no data is found
Bar chart type
Required
Dataset
Required
Chart size
Required
Series colors
Chart title
Chart title style
Visible axes
Legend
Advanced parameters
Action
This is an event a Zap performs.
Write
Create a new record or update an existing record in your app.
Parameters
Required
Action
This is an event a Zap performs.
Write
Create a new record or update an existing record in your app.
Dataset
Required
Chart size
Required
Series colors
Chart title
Chart title style
Visible axes
Legend
Advanced parameters
Action
This is an event a Zap performs.
Write
Create a new record or update an existing record in your app.
Chart size
Required
Data
Required
Advanced parameters
Action
This is an event a Zap performs.
Write
Create a new record or update an existing record in your app.
Dataset
Required
Chart size
Required
Series colors
Chart title
Chart title style
Visible axes
Legend
Advanced parameters
Action
This is an event a Zap performs.
Write
Create a new record or update an existing record in your app.
For AI agents & developers
Use Google Sheets and Image-Charts with AI agents and code
Beyond Zap workflows. Call Google Sheets and Image-Charts actions directly from your AI client or your codebase, using the same 9,000+ app integrations Zapier already runs.
No code
Connect via Zapier MCP
Expose Google Sheets and Image-Charts actions as tools in any MCP client. Authenticate once, then call them in natural language.
Example actions on this page
Create Spreadsheet Column
Create a Bar Chart
Works with
Claude · ChatGPT · Cursor · any MCP-compatible client
There is no Python package yet. SDK is TypeScript-only (@zapier/zapier-sdk). The MCP server URL is personal to your account; get it at zapier.com/mcp.
Zapier is the automation platform of choice for 87% of Forbes Cloud 100 companies in 2023
93%
Customers who say using Zapier has made them better at their job
25m
Customers have created over 25 million Zaps on the platform
6 mins
The average user takes less than 6 minutes to set up a Zap
Connect Google Sheets and Image-Charts to integrate crucial parts of your business
With Zapier, you can integrate everything from basic data entry to end-to-end processes. Here are some of the business-critical workflows that people automate with Zapier.
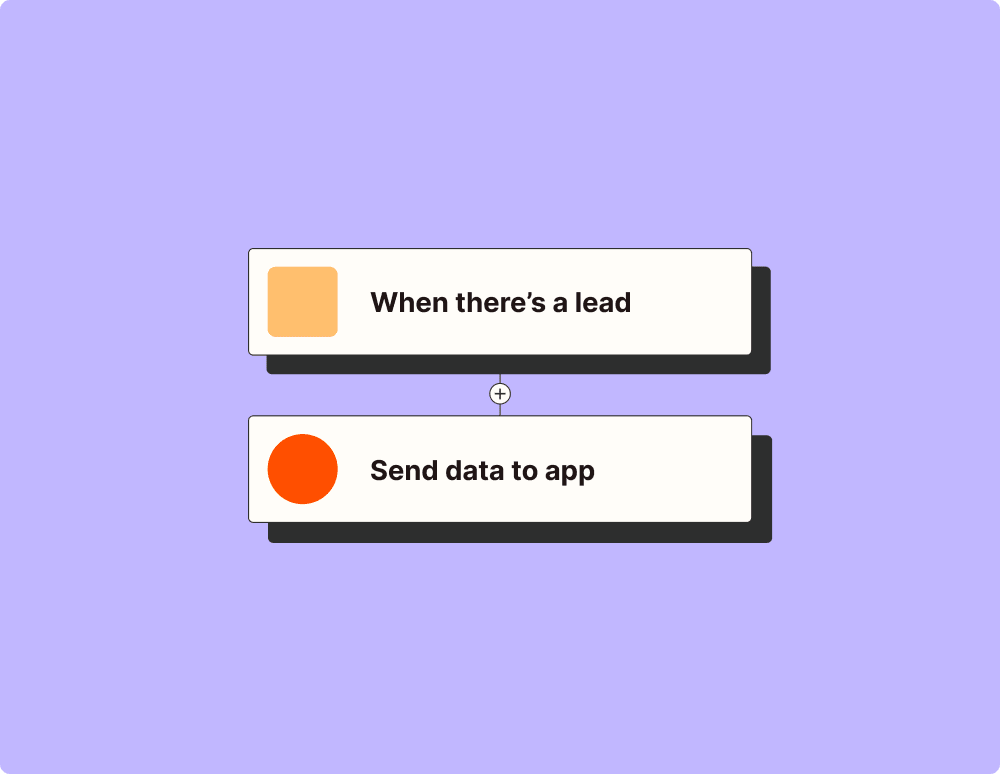
Automate your lead management and improve conversions
With Zapier, you can automate every part of your lead funnel and give yourself the best chance at converting leads. Automate everything from lead capture to outreach to reporting—and close more deals as a result.
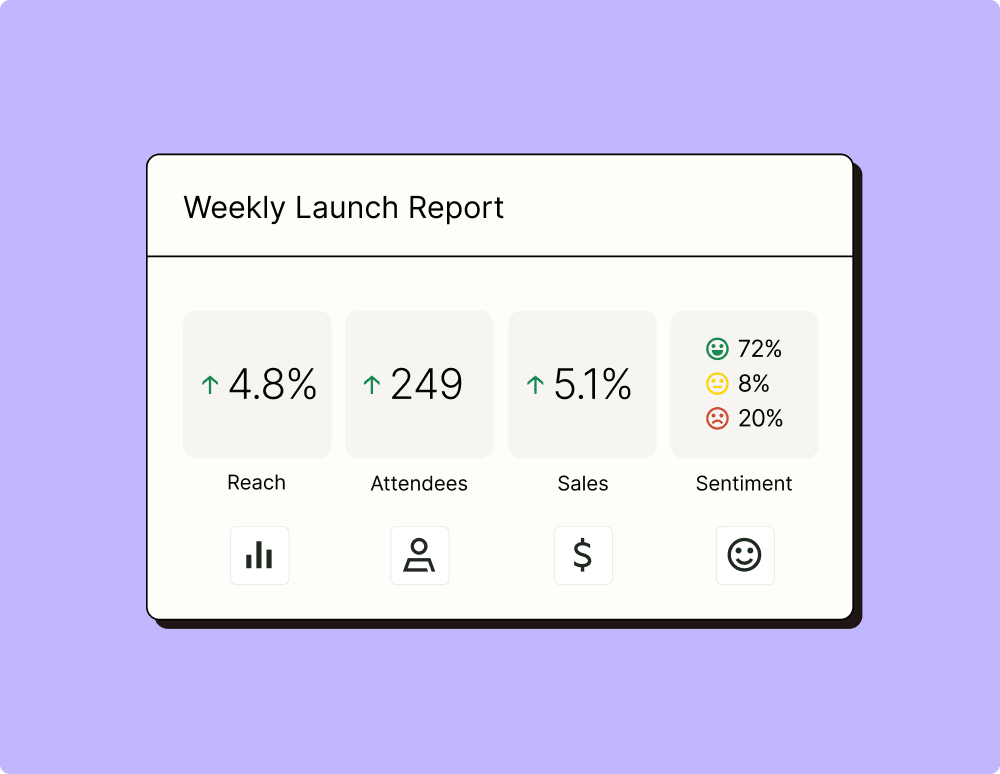
Create more impactful campaigns with automation
Measuring campaign performance across platforms can get chaotic. Plus, digging up the right metrics costs you precious time and effort. With Zapier, you can create a centralized view of your performance, skillfully manage your lists, and ensure your campaigns drive ROI across the business.
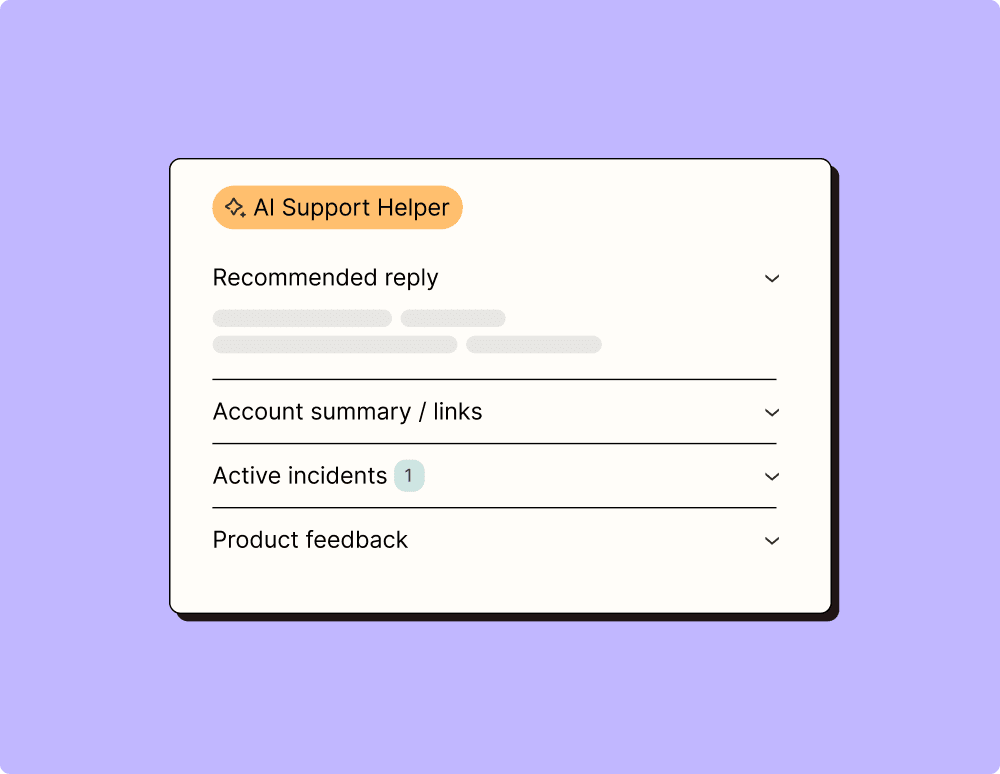
Provide world-class support with a little help from automation
Support reps can't be productive when they have to track down crucial information for every incident or ticket. With Zapier, you can automatically send your reps the context they need to resolve tickets quickly and create a seamless customer experience.
Automate your way to actionable, up-to-date data
The days of manually exporting and importing data are over. With Zapier, you can send data where it needs to go, in the format you need it—so you can centralize your data and unlock more insights.
Resolve incidents faster with automation
Your technical support team wants to focus on tech tickets rather than admin work. With Zapier, you can automate everything from ticket creation to routing to inter-team communication—eliminating friction from incident management and increasing speed to resolution.
Learn how to automate Google Sheets on the Zapier blog
Make work flow with AI
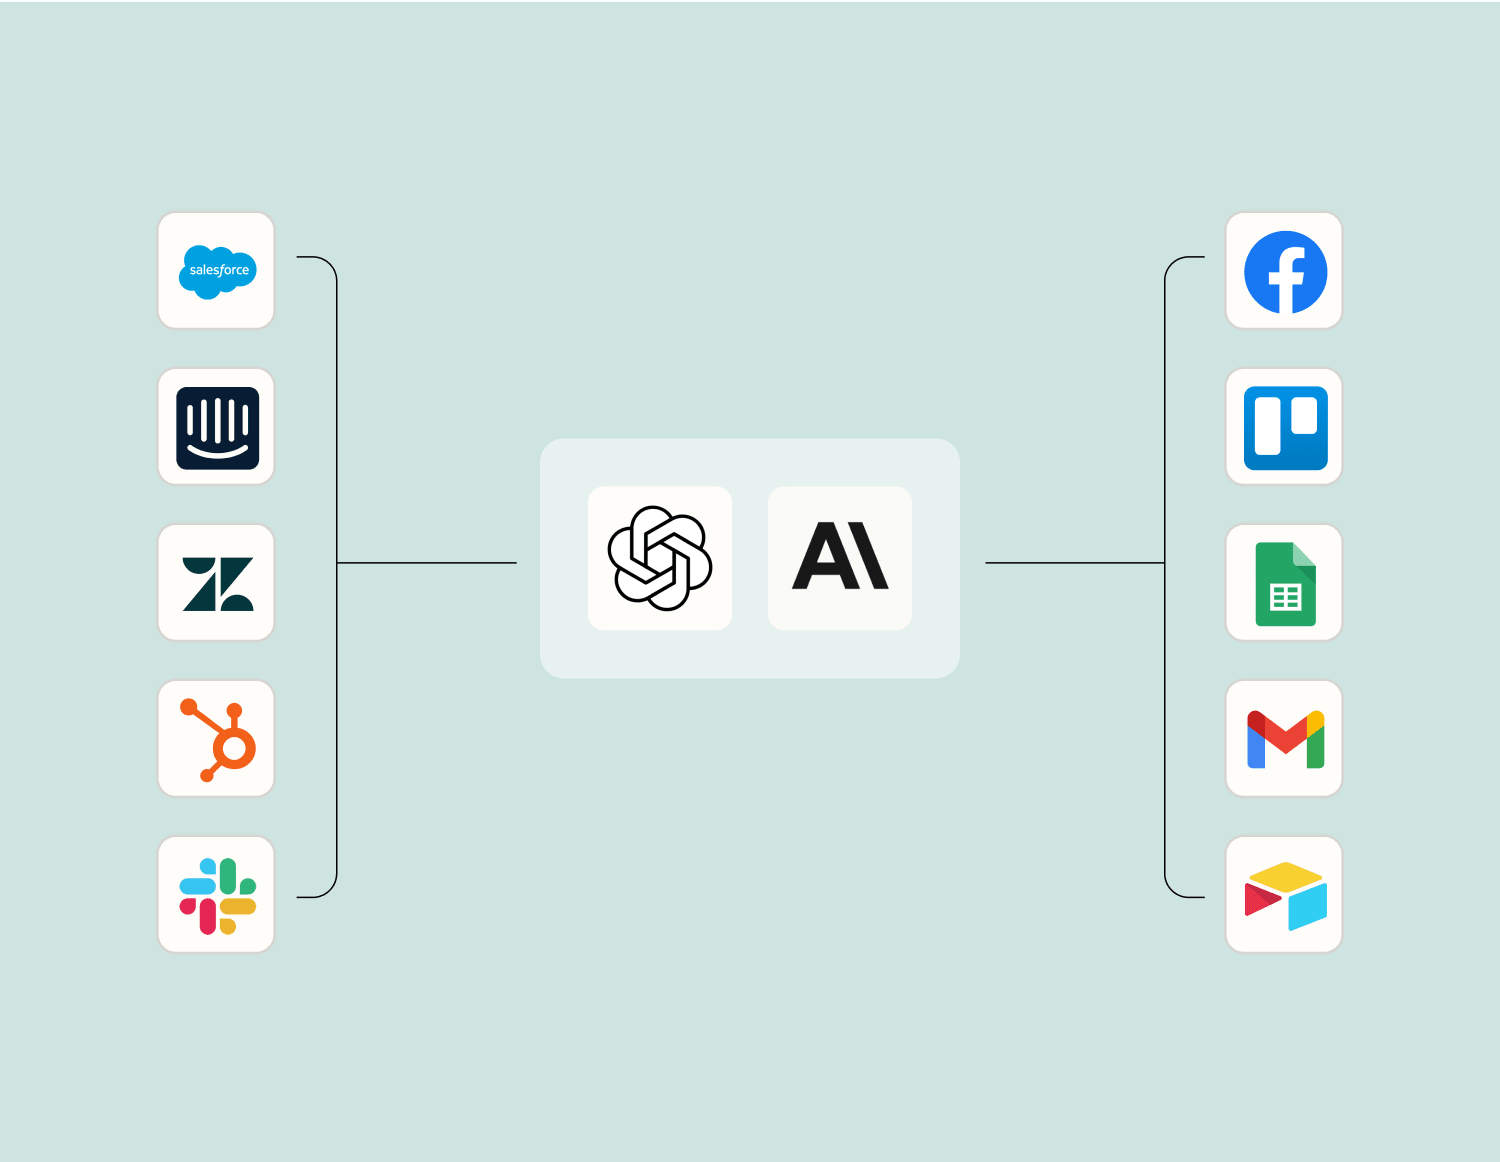
Level up your Google Sheets to Image-Charts integration with AI. Extract, summarize, and transform your integration data with leading AI models like OpenAI, Anthropic, and more.
Frequently Asked Questions about Google Sheets + Image-Charts integrations
New to automation with Zapier? You're not alone. Here are some answers to common questions about how Zapier works with Google Sheets and Image-Charts
How do I integrate Google Sheets with Image-Charts?
By using our platform, you can set up automated workflows to integrate Google Sheets with Image-Charts. This involves setting triggers such as a new row added to the Google Sheet which prompts an action like creating a chart in Image-Charts.
What types of charts can be generated when integrating with Image-Charts via your platform?
You have the ability to generate various types of charts, including bar charts, pie charts, line charts, and more. The type of chart can be selected and customized based on the data provided in your Google Sheets.
Can I update existing charts in Image-Charts using data from Google Sheets?
Yes, you can set up actions that update existing charts in Image-Charts whenever there is a specific trigger such as a change or update in the data within your Google Sheets.
How can I trigger a chart creation automatically from my Google Sheet?
A chart creation can be triggered automatically by setting up specific conditions, like adding new data entries to your sheet or changing certain values that prompt the generation of a new chart.
Is it possible to customize the appearance of the charts created via integration?
Absolutely. When creating or updating charts through our integration with Image-Charts, you have options to customize colors, labels, sizes, and many other visual elements according to your needs.
What happens if there is an error during the integration process between Google Sheets and Image-Charts?
Our system will alert you if there's any issue during an integration process. Common issues include incorrect data formats or connectivity problems, which we provide guidance on resolving swiftly.
Are there any limitations on data volume when integrating with Image-Charts through your service?
While most integrations run smoothly regardless of size, extremely large datasets might require optimization steps. We recommend reviewing our guides for best practices on handling significant volumes efficiently.
About Google Sheets
Create, edit, and share spreadsheets wherever you are with Google Sheets, and get automated insights from your data.
Image-Charts is a service to generate images of bar charts, line charts, pie chart, QR Code (and much more) to embed inside PDF reports, emails, and more.