There's a powerful tool hiding in your browser: Inspect Element. Right-click on any webpage, click Inspect, and you get a live view of that site's underlying HTML, CSS, and JavaScript—the source code, images, fonts, animations, load times, and exact color values that make it tick. And you can temporarily edit any of it, right there in the browser.
It's a perfect way to learn how websites are built, debug something broken on your own site, mock up design changes without touching a staging environment, or remove private details from a screenshot without opening Photoshop. Here's how to use it.
Table of contents:
What is Inspect Element?
Inspect Element is a developer tool built into every major browser. It lets you view and temporarily edit the HTML, CSS, and JavaScript behind any webpage in real time. Nothing you change is permanent. Close the tab or refresh the page, and everything reverts to normal.
Here's how you can use Inspect Element across departments:
Designers. Before filing a bug report or spinning up a staging branch, you can tweak padding, swap a font, or shift a color right on the live page—just to see if your instinct is right (because it obviously is).
Marketers. Use it to confirm that tracking pixels are firing and meta tags are in place, or mock up a headline change on a landing page before looping in a developer to push the changes live.
Writers. Test how a revised headline actually reads in context on the page (instead of crudely sketched out on a napkin).
Developers. Debug CSS conflicts, trace what an API is actually returning, or test a JavaScript tweak without touching staging.
Customer support. Replicate an error reported by a customer, so you can see exactly what they're seeing without waiting on a developer to investigate.
How to open Inspect Element
Every major browser gives you a few ways to open Inspect Element. The steps vary slightly between Chrome, Firefox, and Safari, but once you've opened it in one, you'll find your way around the others pretty quickly.
How to open Inspect Element in Chrome
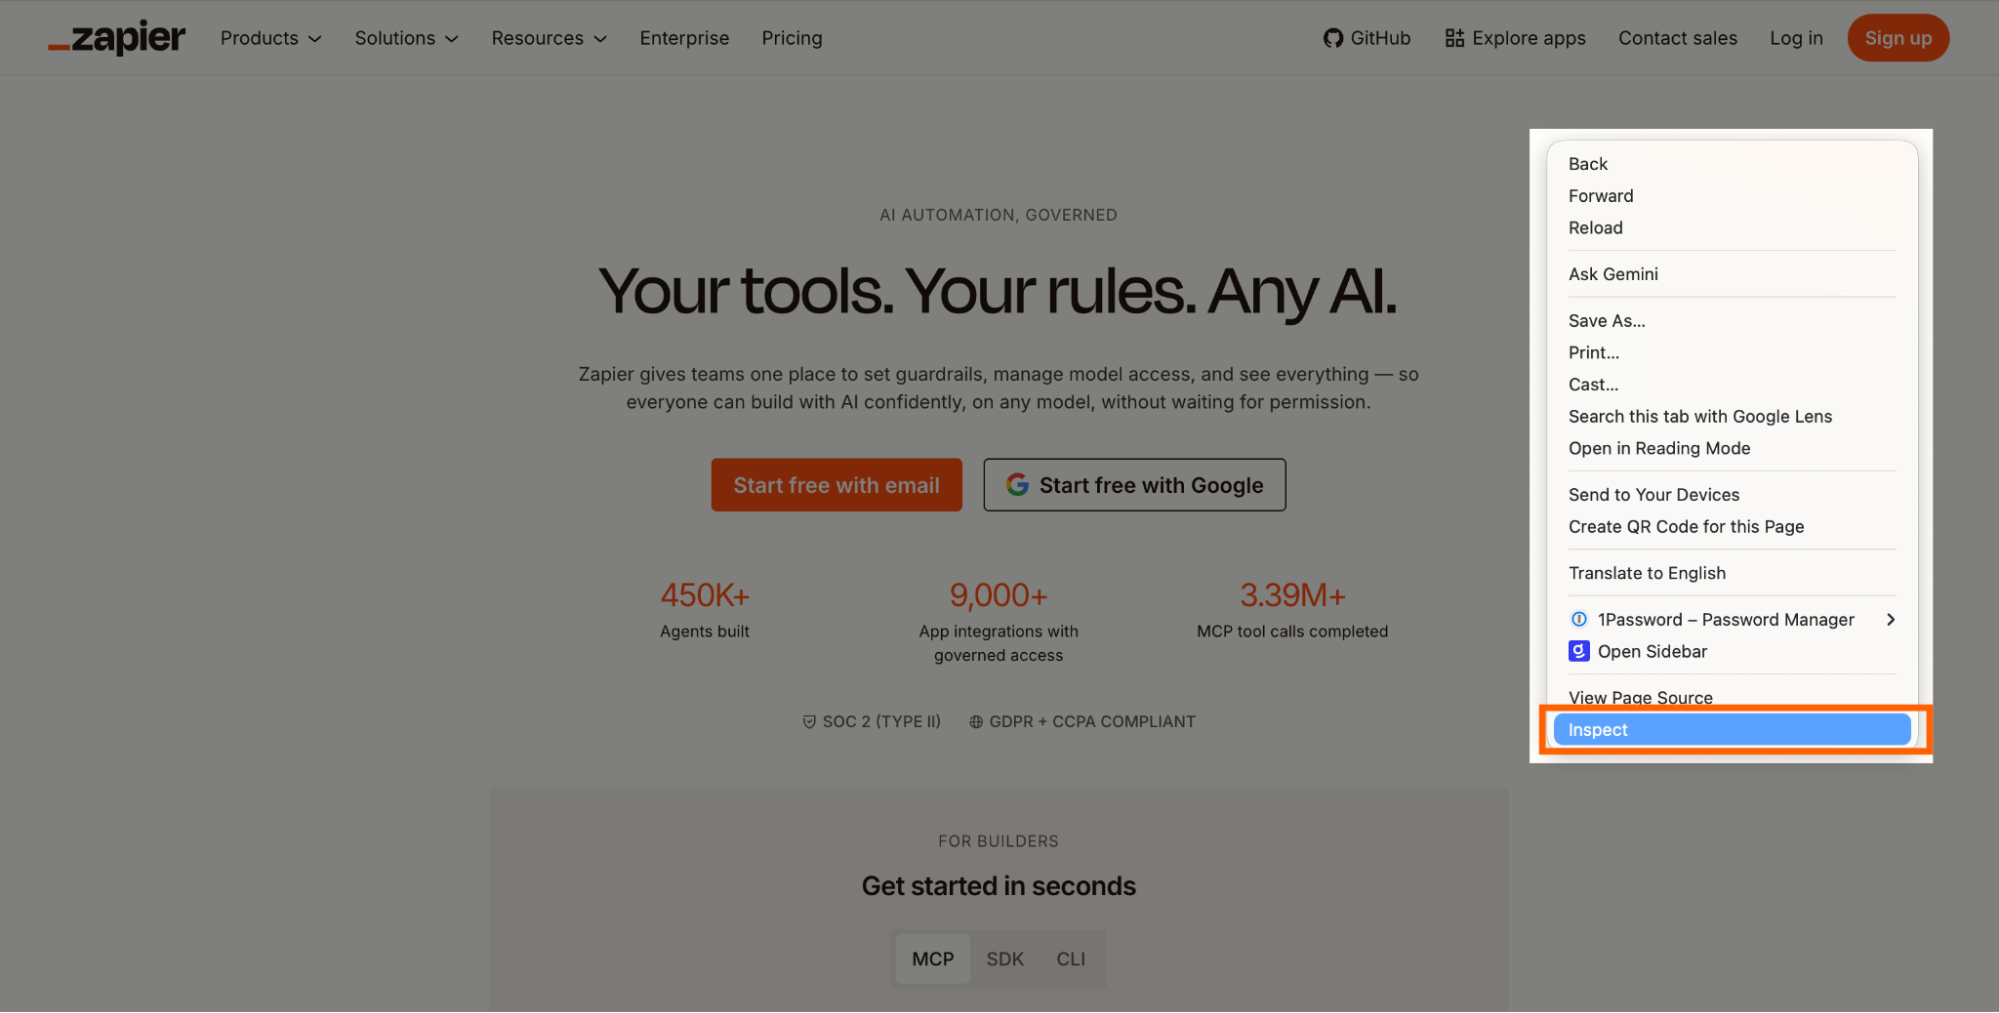
Method 1: Right-click anywhere on the page, and click Inspect at the bottom of the menu.
Method 2: Click the kebab menu (
⋮) on the far right of your Google Chrome toolbar, click More Tools, then select Developer Tools.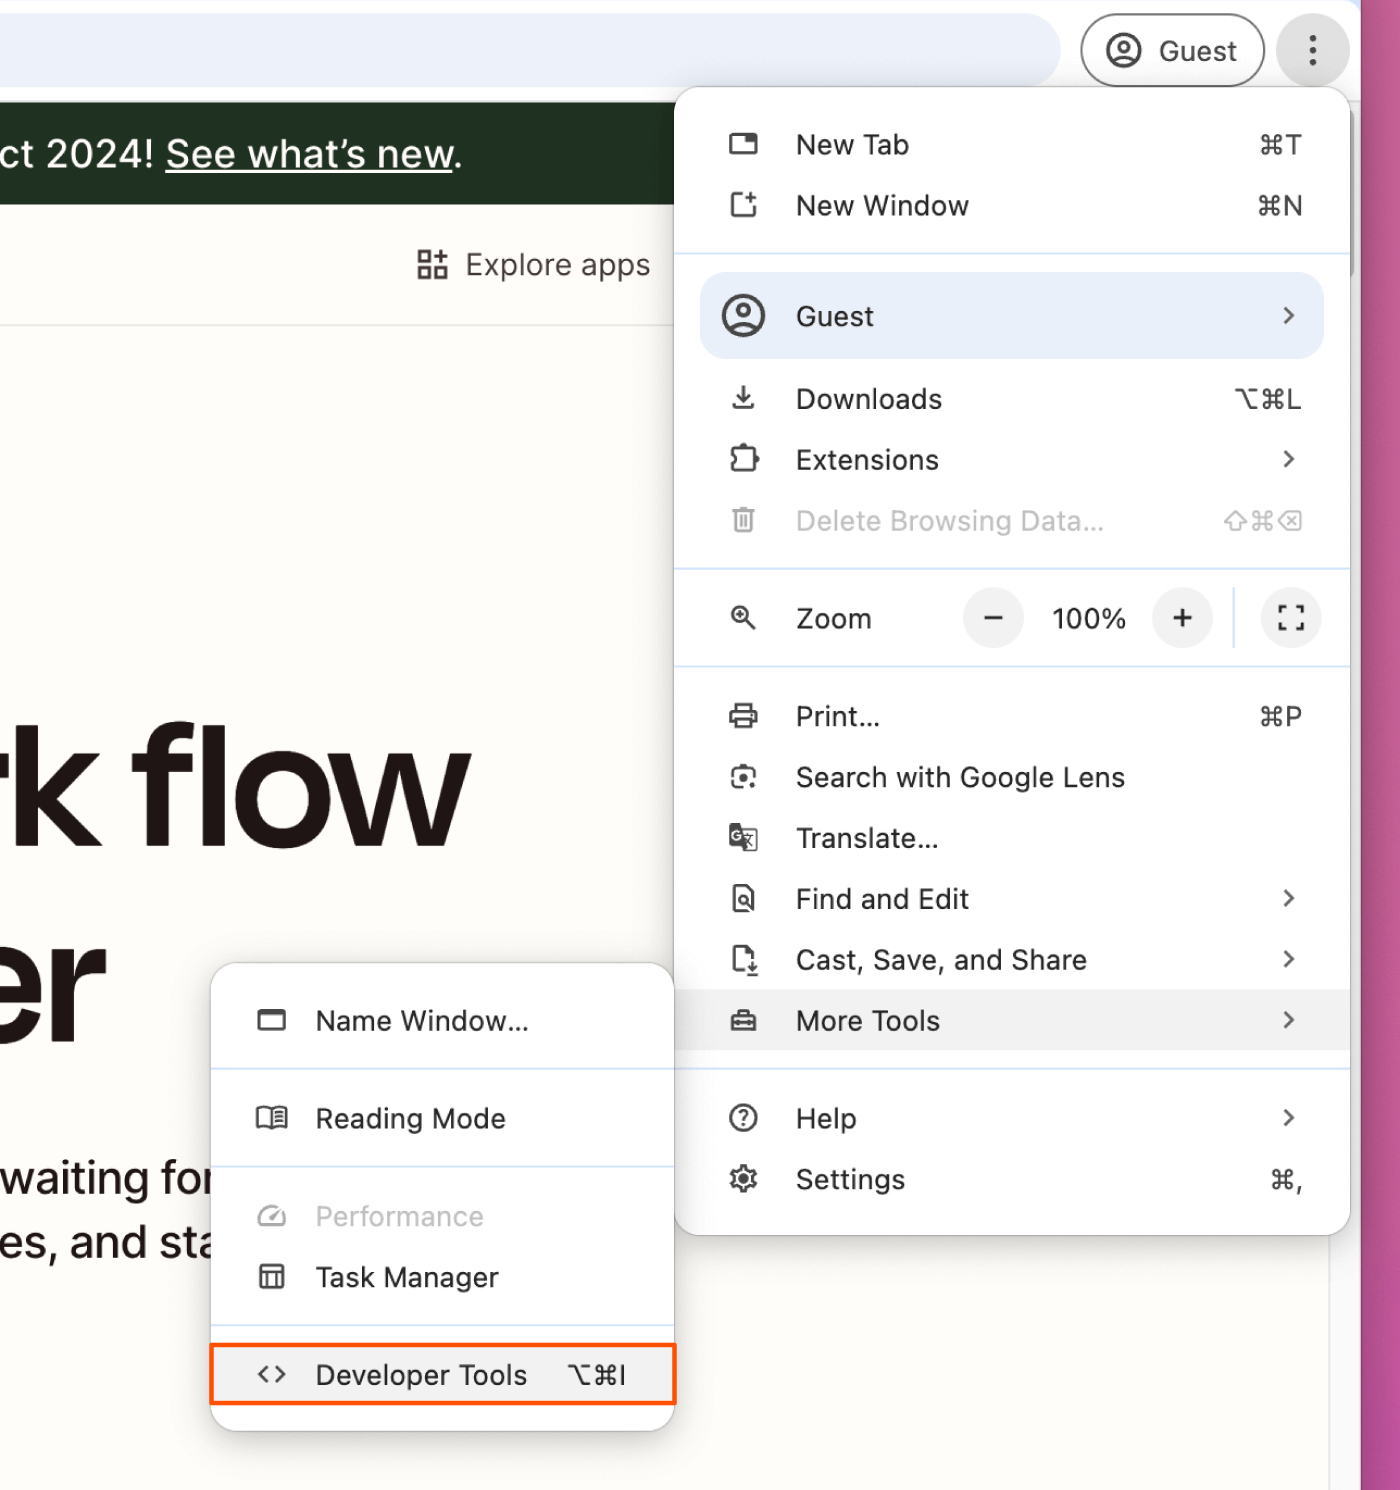
Method 3: Use a keyboard shortcut:
command+option+I(Mac) orCtrl+Shift+C(Windows).


By default, Developer Tools ("DevTools") opens to the Elements tab—that's Inspect Element. To reposition the pane, click the kebab menu (⋮) inside DevTools and choose to dock it to the bottom, left, or right, or pop it into a separate window. You can also drag the pane's border to resize it.

How to open Inspect Element in Firefox
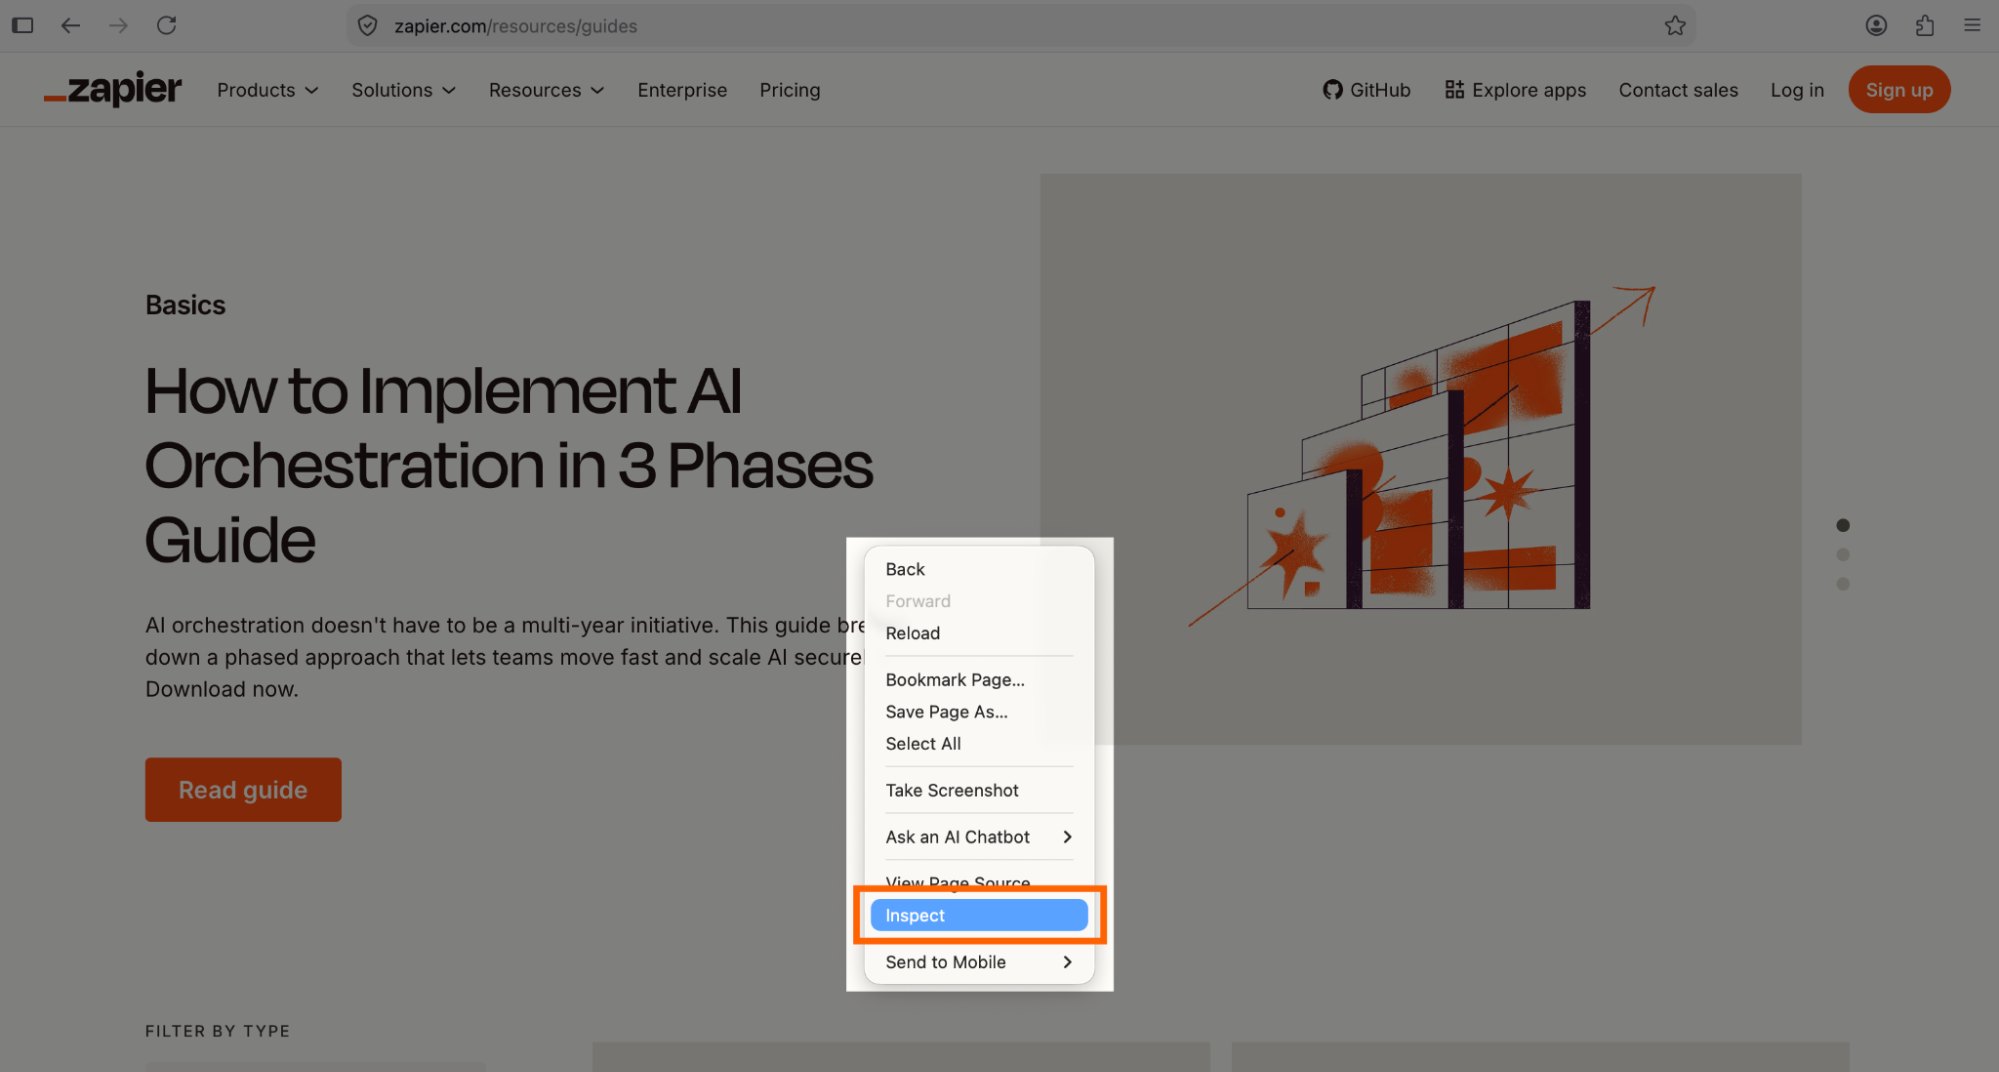
Method 1: Right-click anywhere on the page, and click Inspect at the bottom of the menu.
Method 2: Click the hamburger menu (
≡) in the top-right corner of the window, select More tools, then click Web Developer Tools.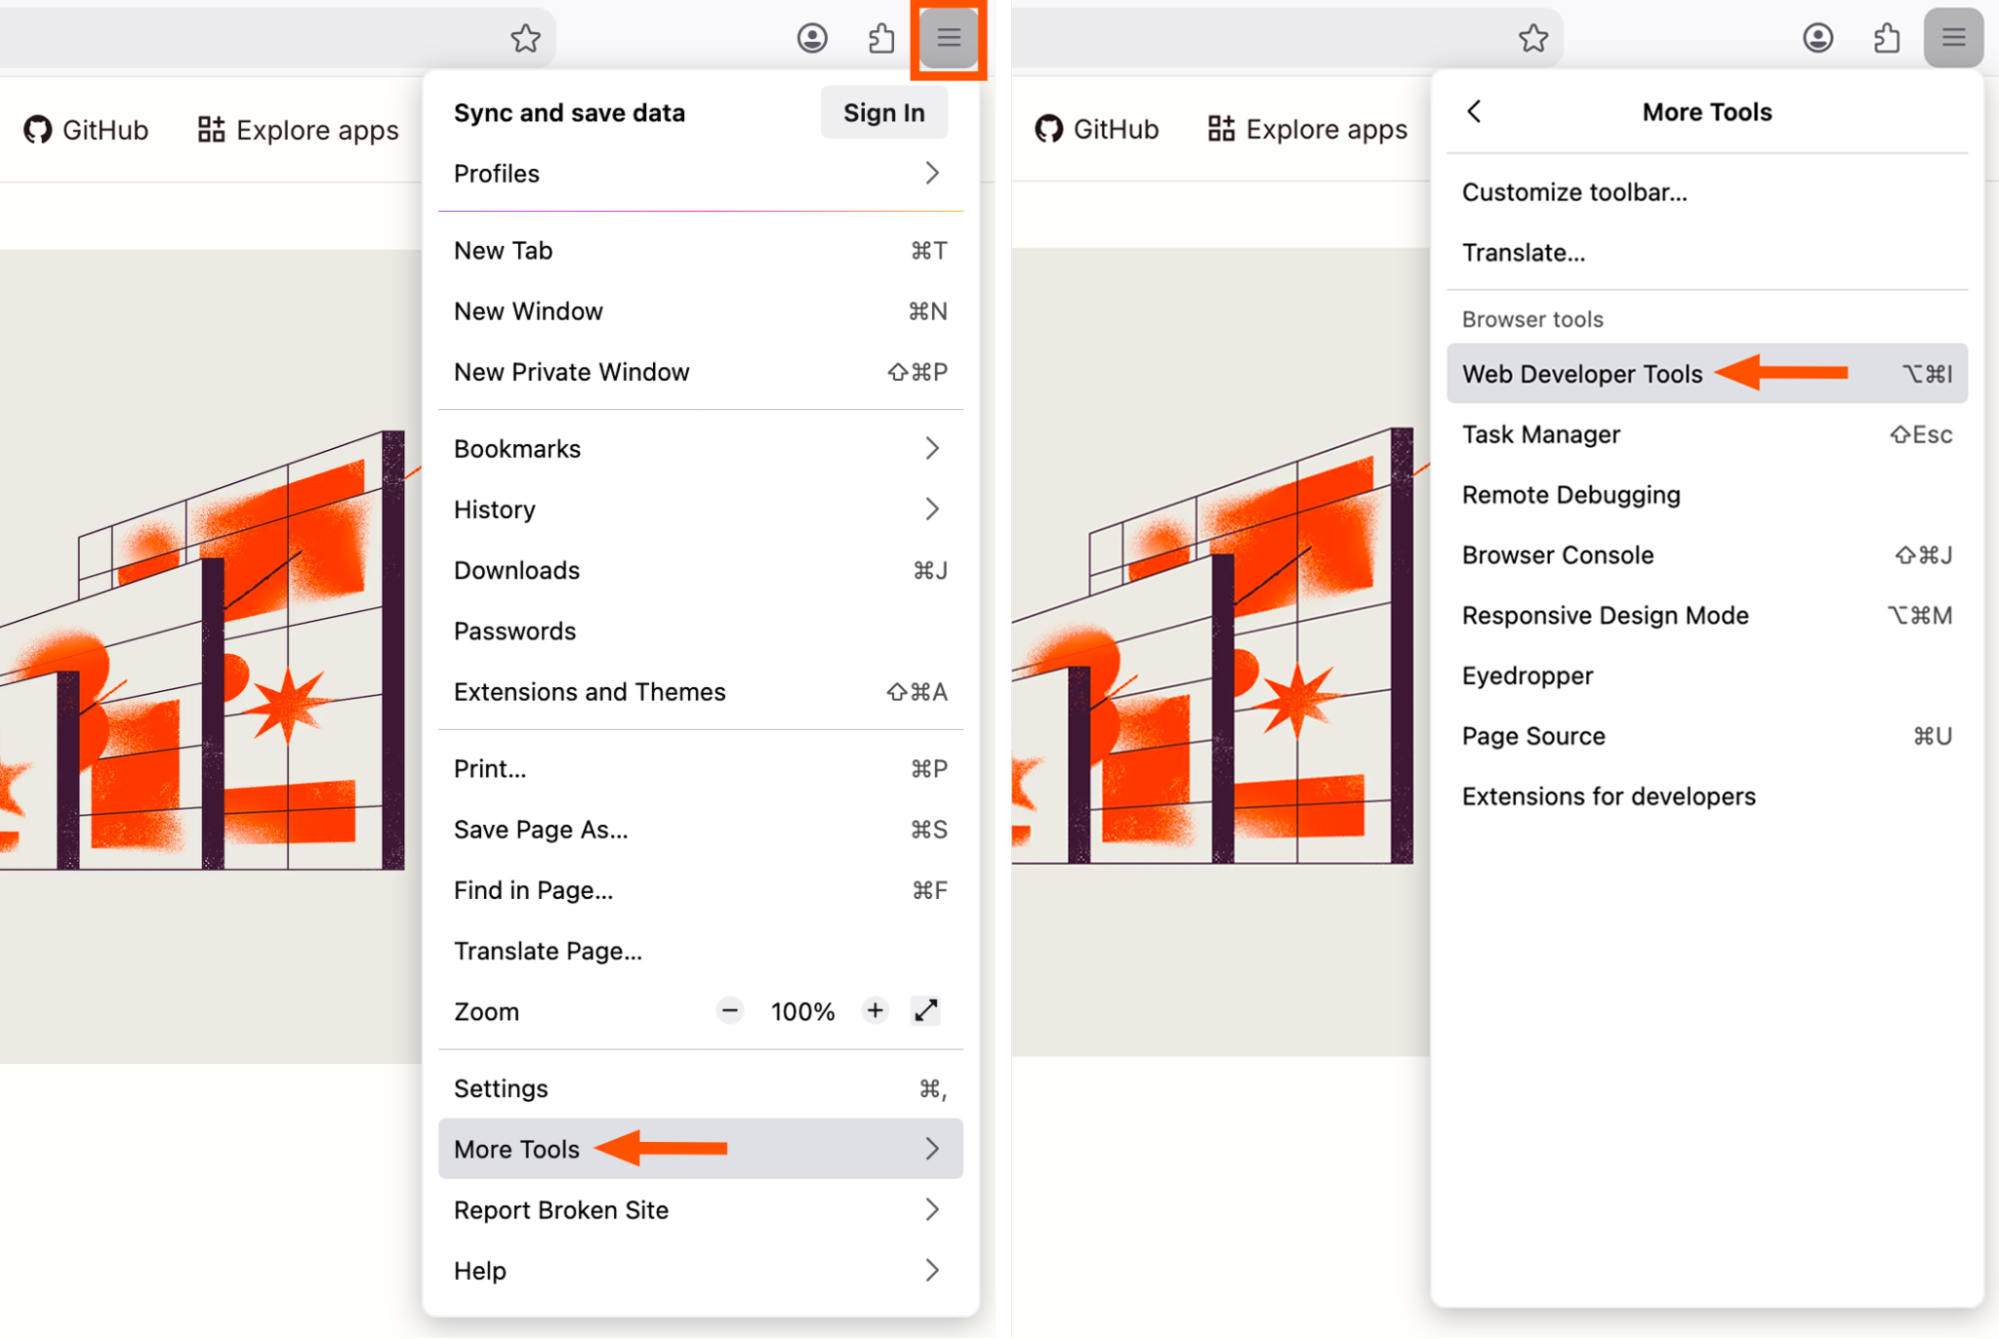
Method 3: Use the keyboard shortcut:
command+option+I(Mac) orCtrl+Shift+C(Windows).


Firefox opens the pane at the bottom of the window by default. To move it to the side, click the three dots (...) near the X in the top-right corner of the pane, and select where you want to dock it. You can also pop it into a separate window, or drag the pane's border to resize it.

How to open Inspect Element in Safari
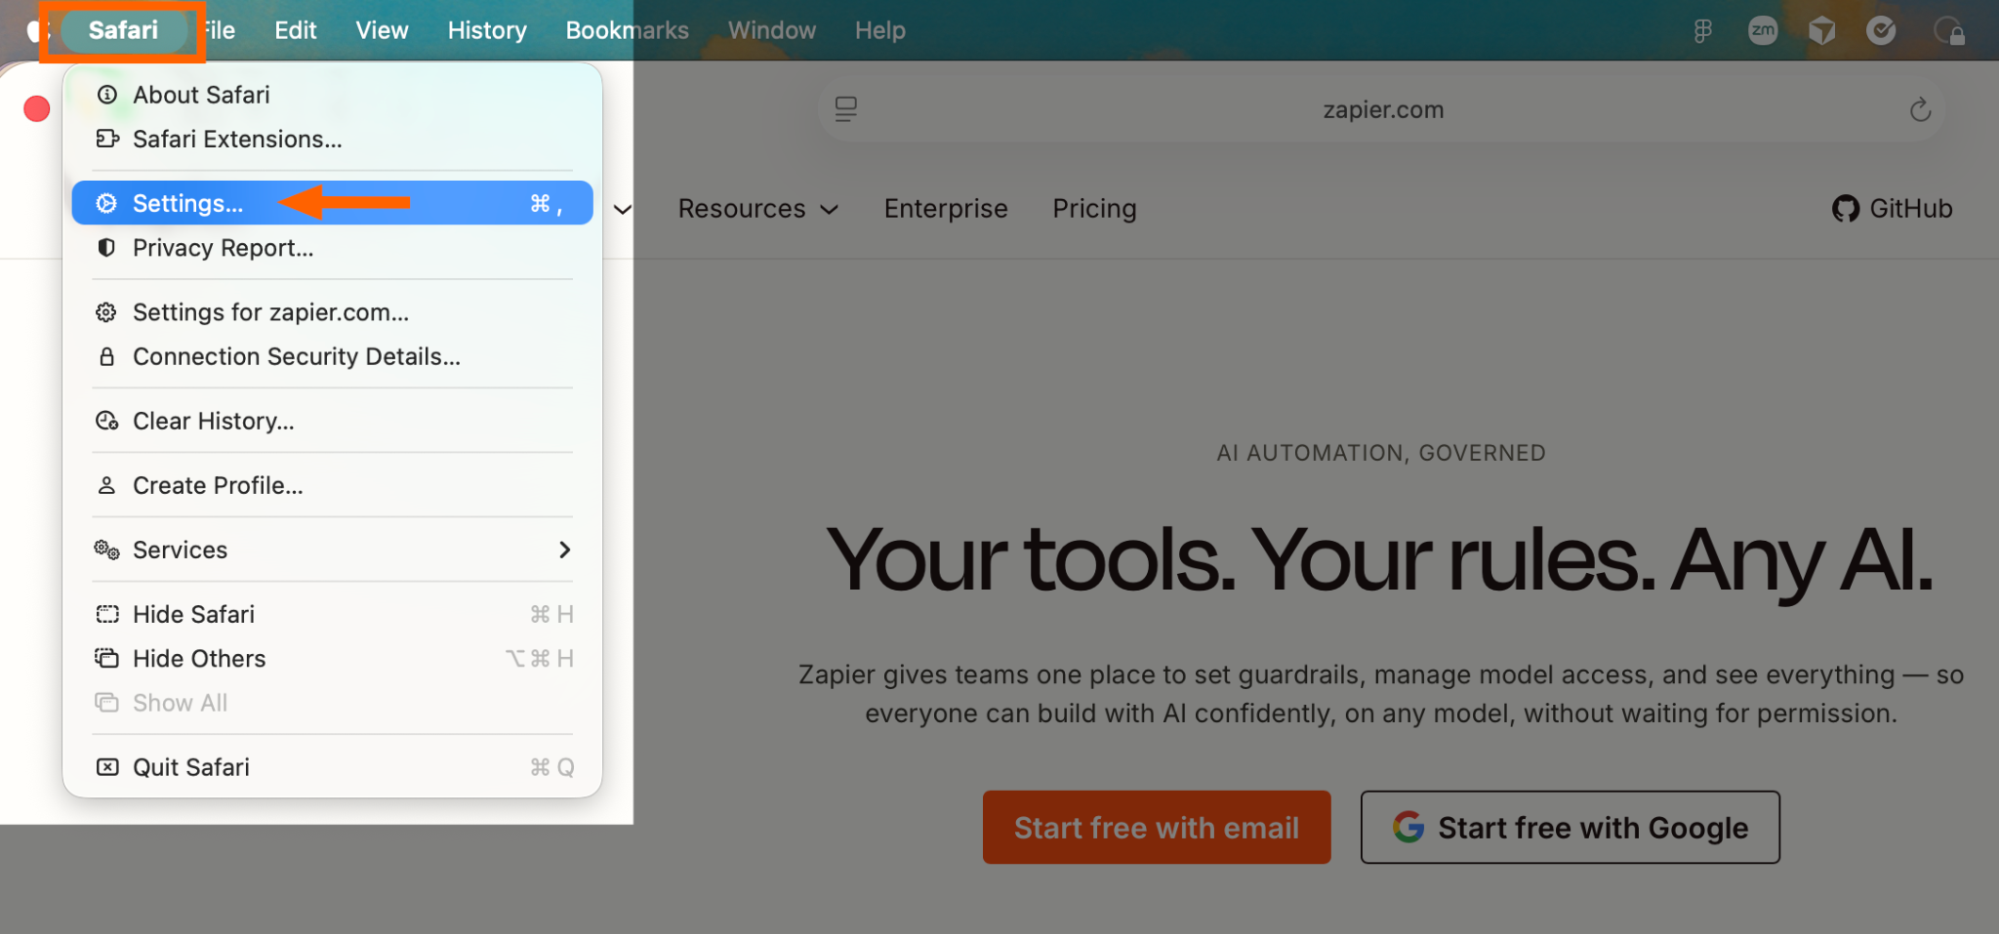
To launch Inspect Element with Safari, you'll need to activate the developer capabilities in the advanced settings first. Here's how.
Click Safari in the menu bar, and select Settings or Preferences (depending on the version of macOS).
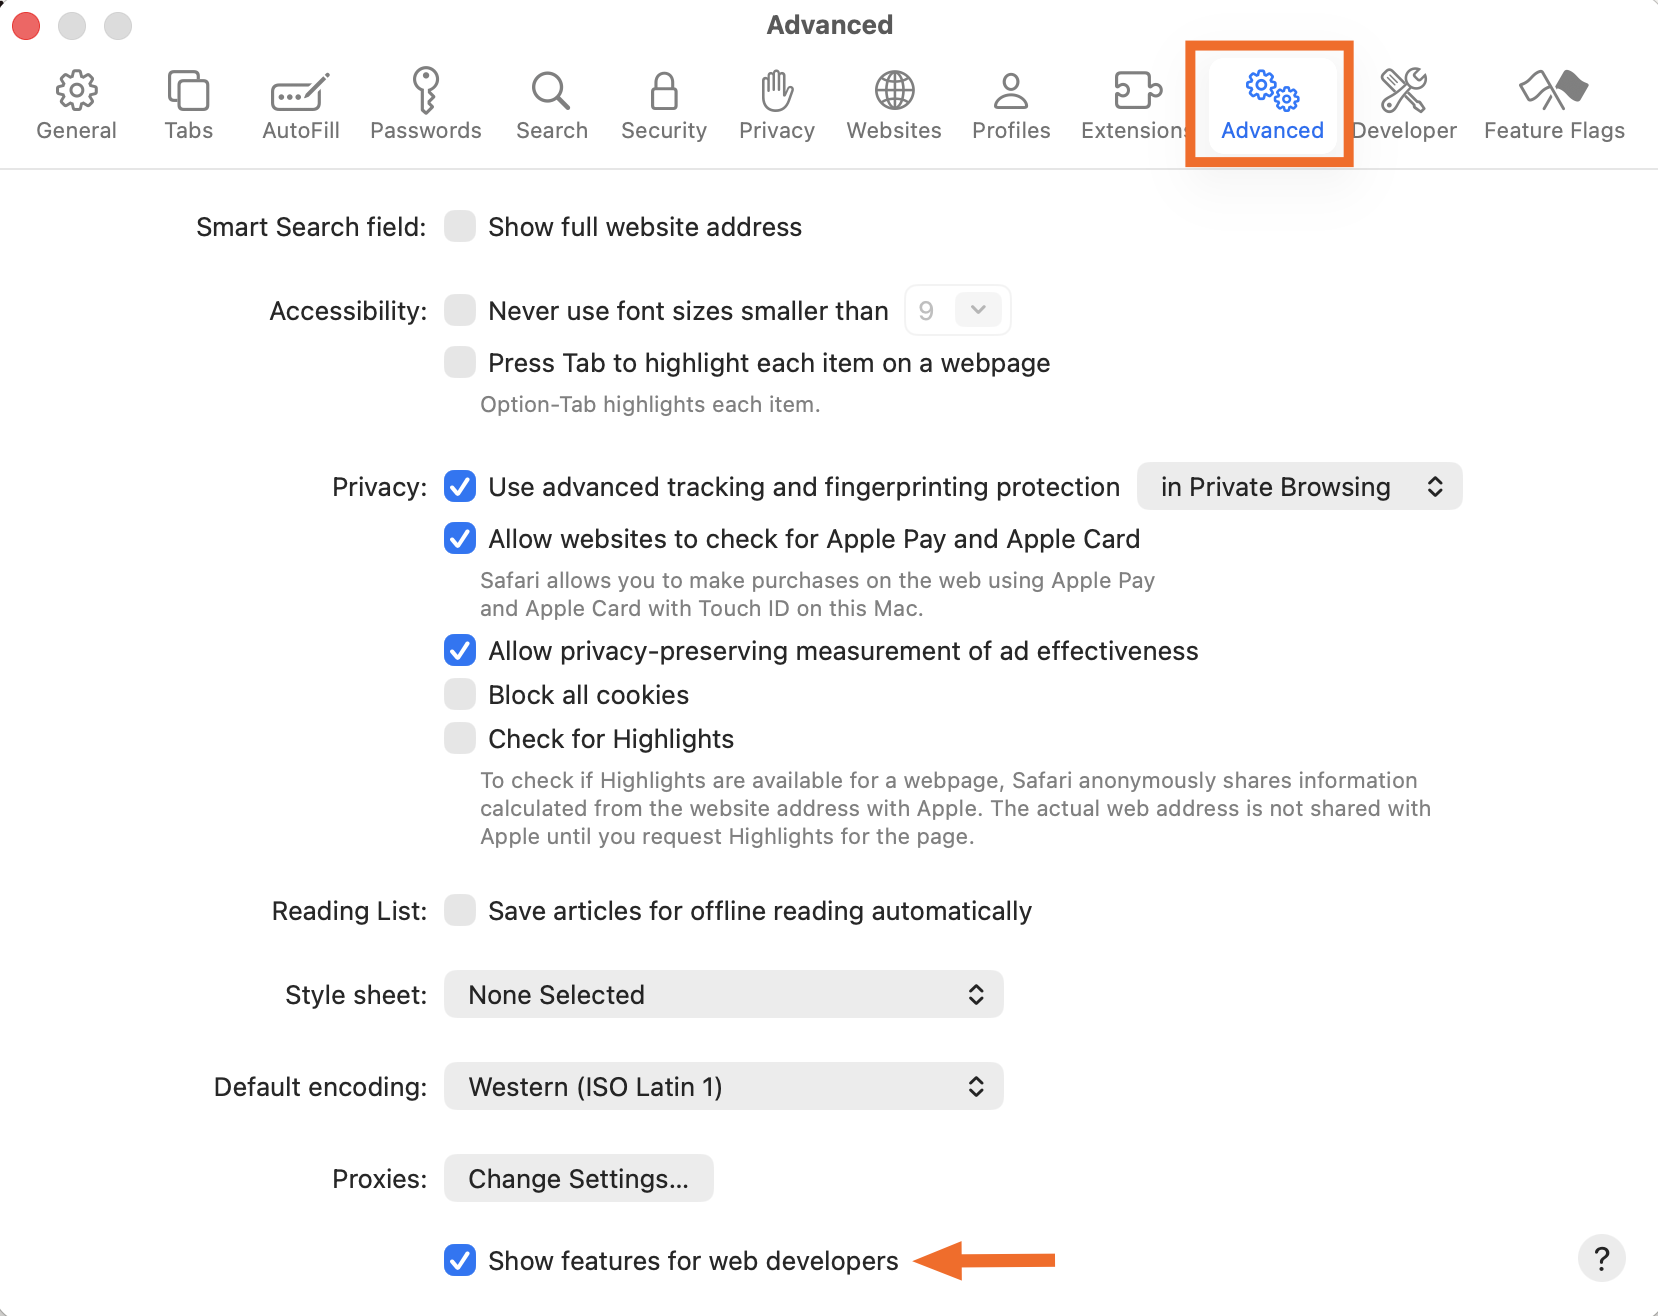
Click the Advanced tab.
Check the box next to Show features for web developers, and then close the window.
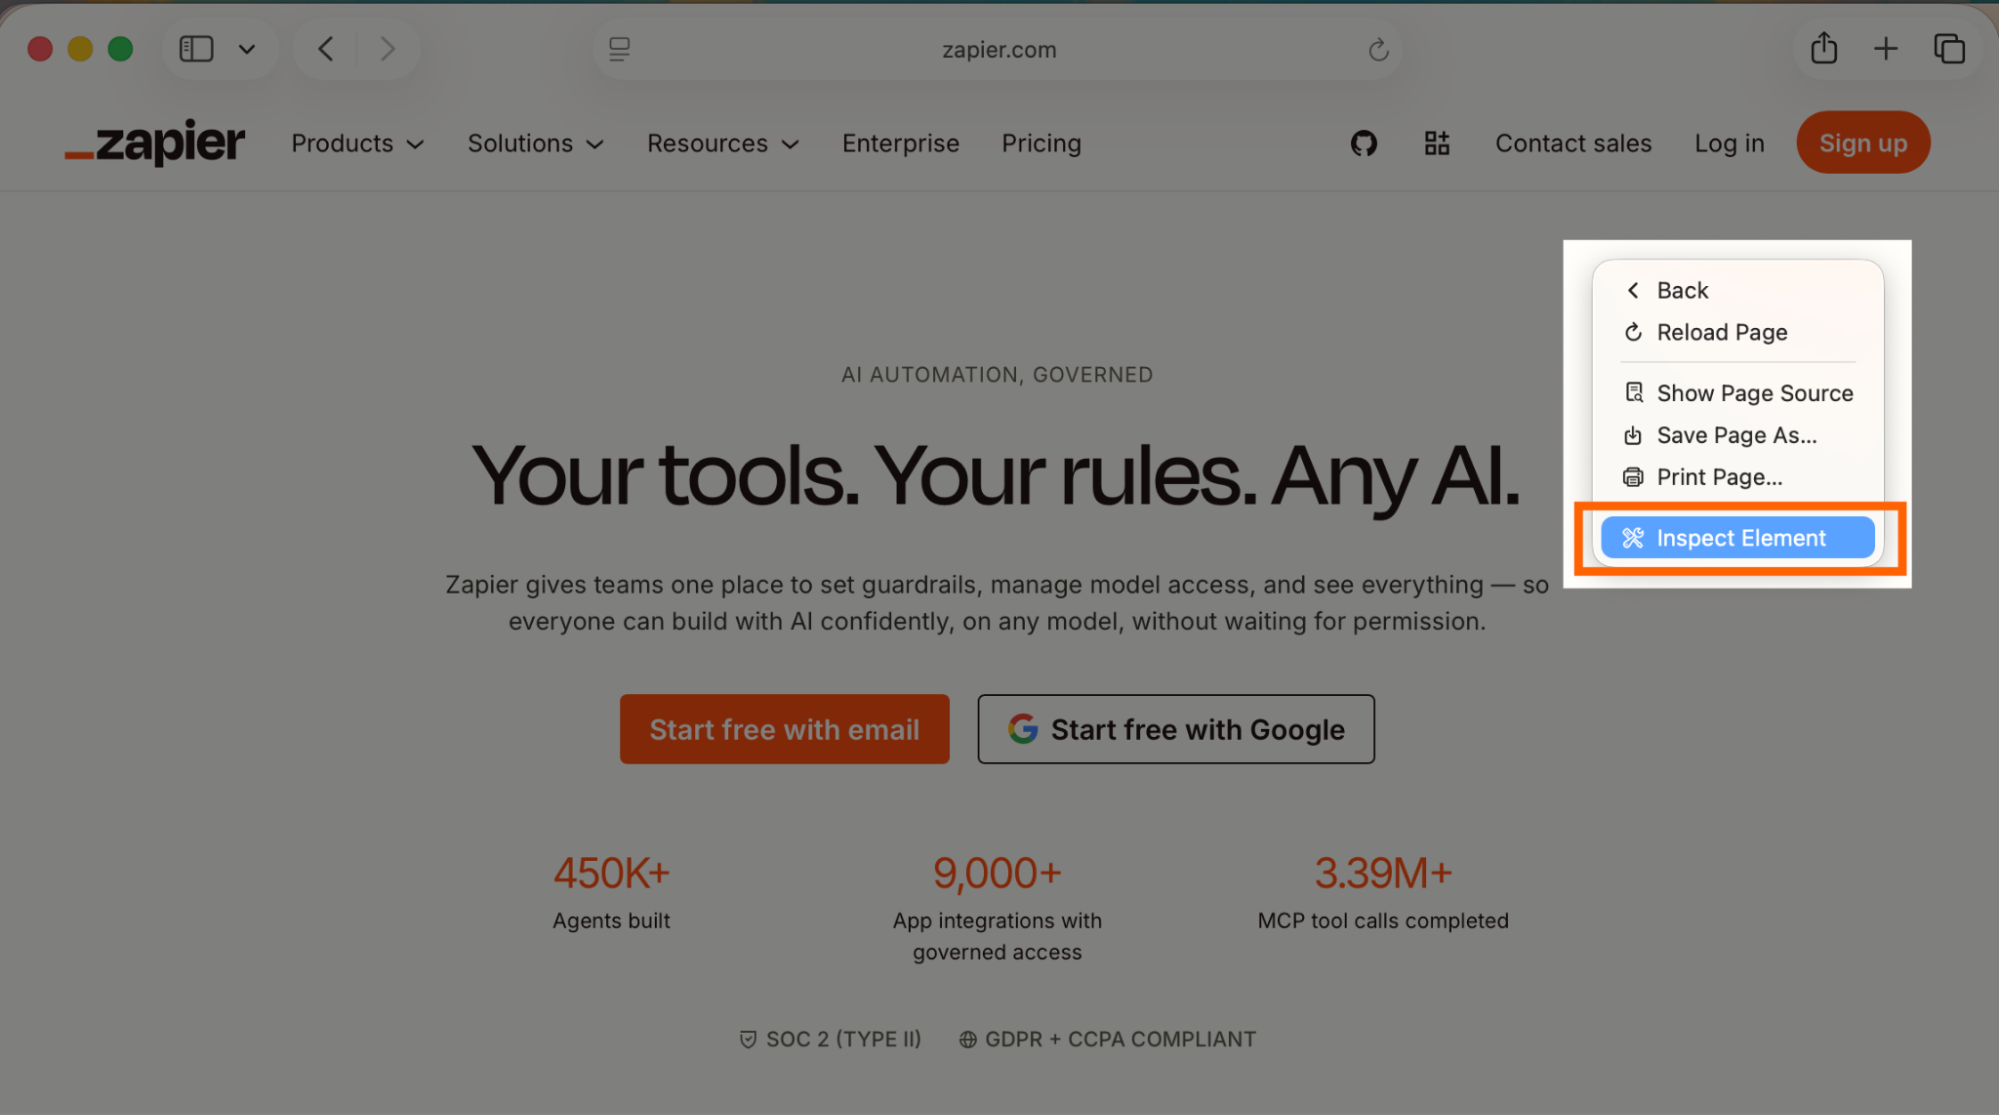
Right-click anywhere on the page, and click Inspect Element.


Similar to Firefox, Safari automatically opens the pane at the bottom of the window. To reposition it, click the dock icons (small squares) in the top-left corner of the pane. You can also detach it into a separate window or drag the pane's border to resize it.

How to inspect element in Chrome, Firefox, and Safari
Once DevTools is open, there's a lot you can do with it. Here's a rundown of practical ways you can use it. (Note: I'm using Chrome, but the core features work the same across major browsers.)
Search: find anything on a page
Chrome's Search lets you search across every file the browser loaded, including HTML, CSS, JavaScript, image paths, color values, and metadata.
To open it, launch Inspect Element, click the kebab menu (⋮), and select Search. A search tab will appear in the lower half of the DevTools pane.

Firefox and Safari can search, too (use your command/Ctrl + F keyboard shortcut). But they search only the tab you have open at the time, so you have to be in the right one. For example, Inspector for HTML and meta tags or Debugger for JavaScript. Chrome, on the other hand, does all of that in one go.
Here's what you can do with Search:
Find SEO tags. Type
meta nameinto the search field to surface every meta tag on the page: title, description, robots settings, and any keywords the page is targeting.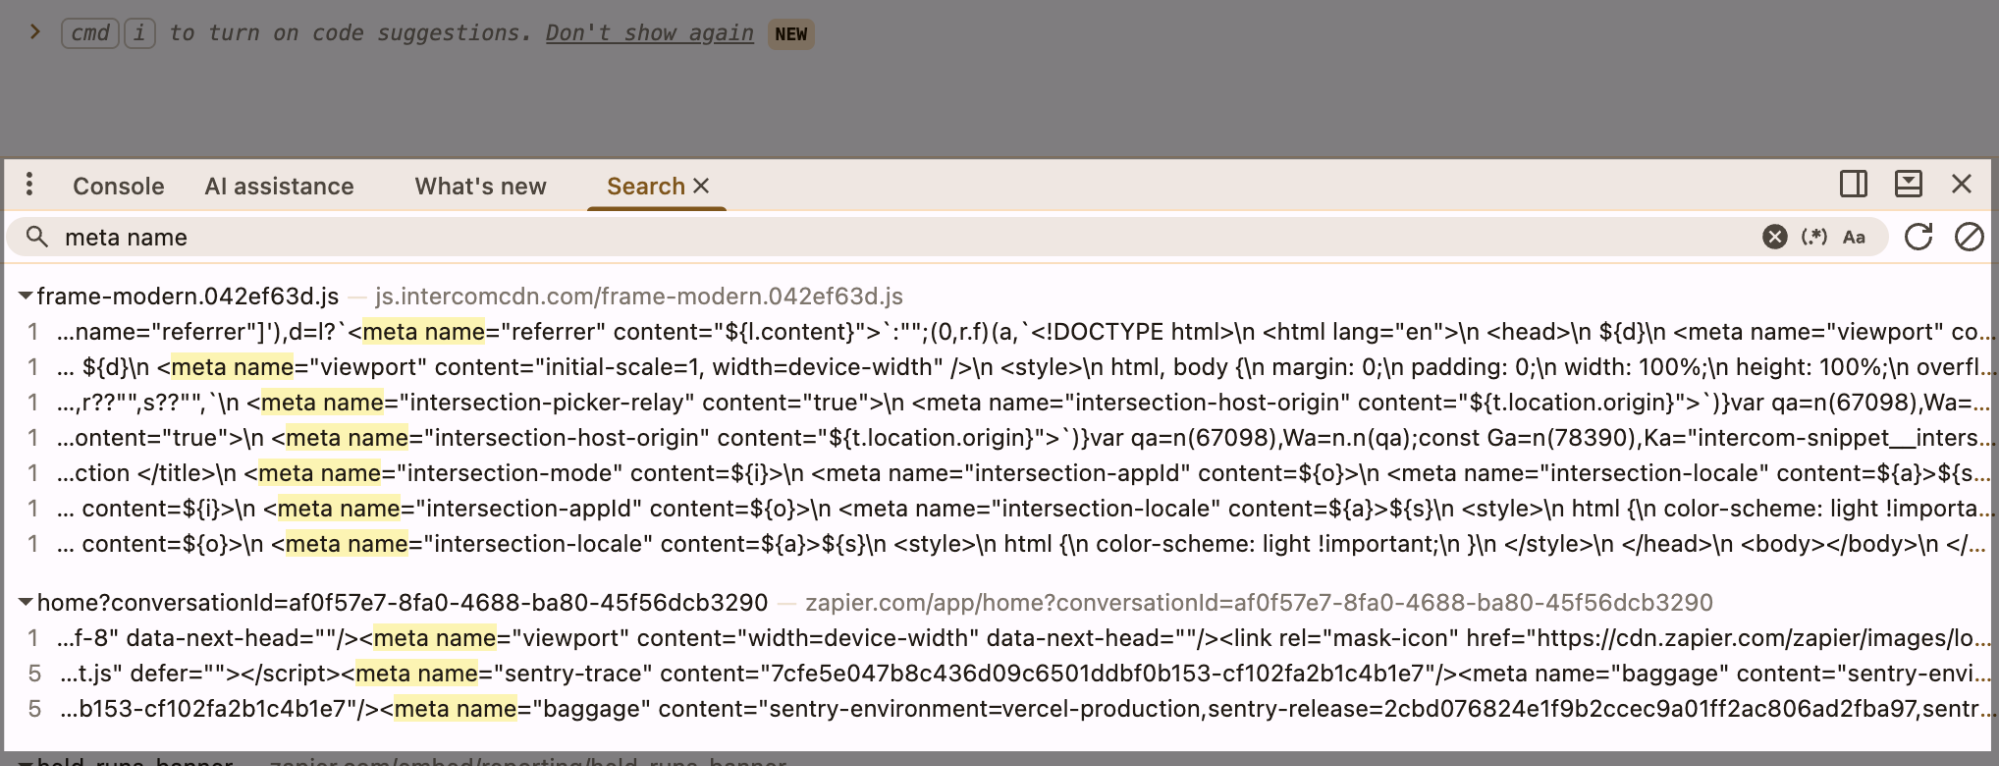
Track down a color. Type a hex value like
#ff4a00to see every place that color appears across the page's CSS and HTML. Click any result to jump directly to that line.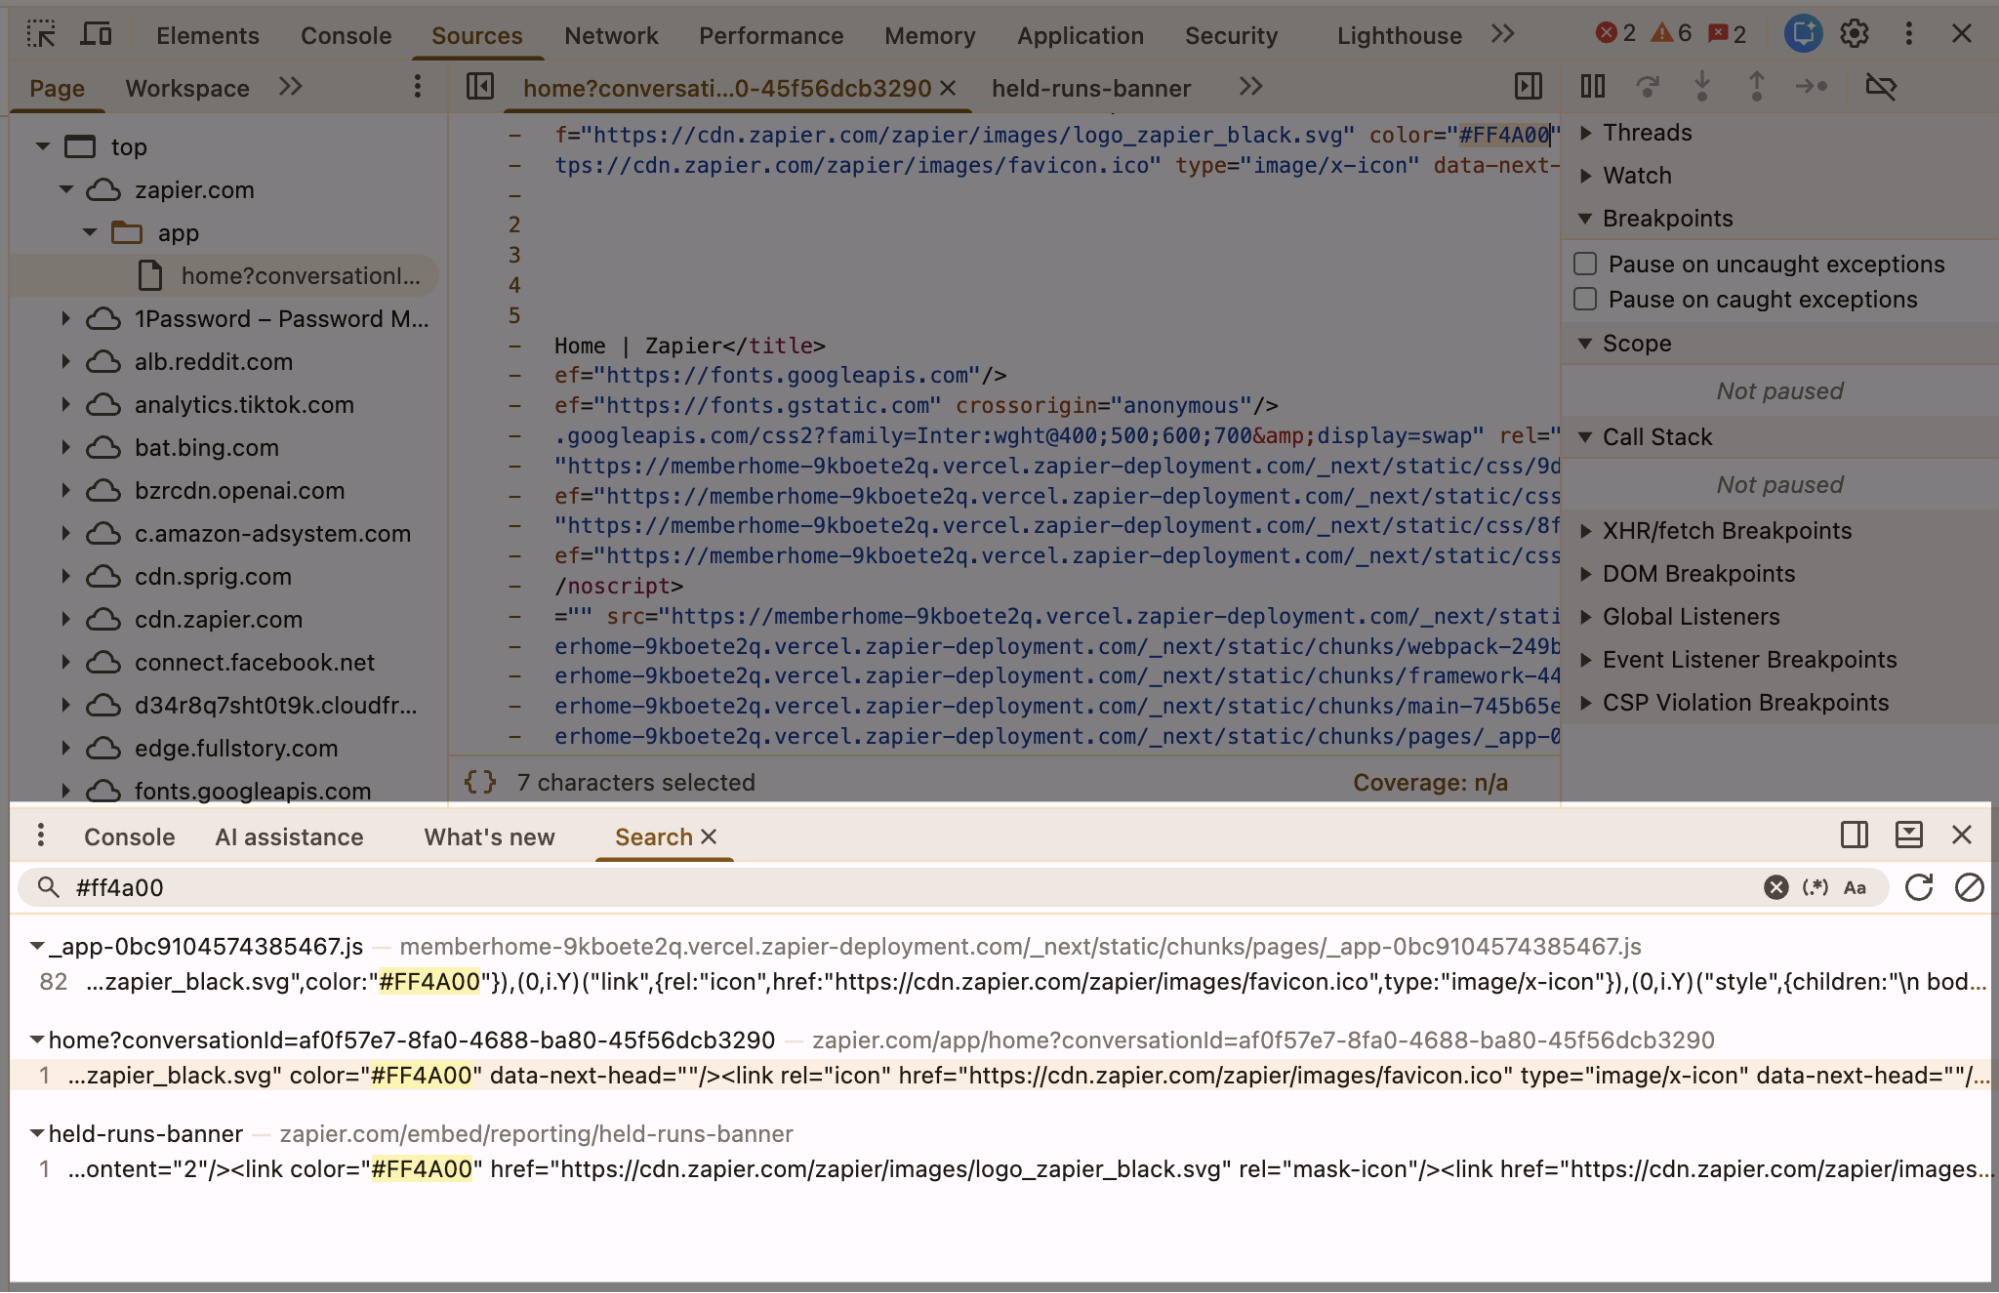


Elements: temporarily edit the page
The Elements tab lets you temporarily modify the HTML and CSS of any webpage, which is useful for previewing a headline rewrite, mocking up a design change, or checking how a layout holds up with different copy.
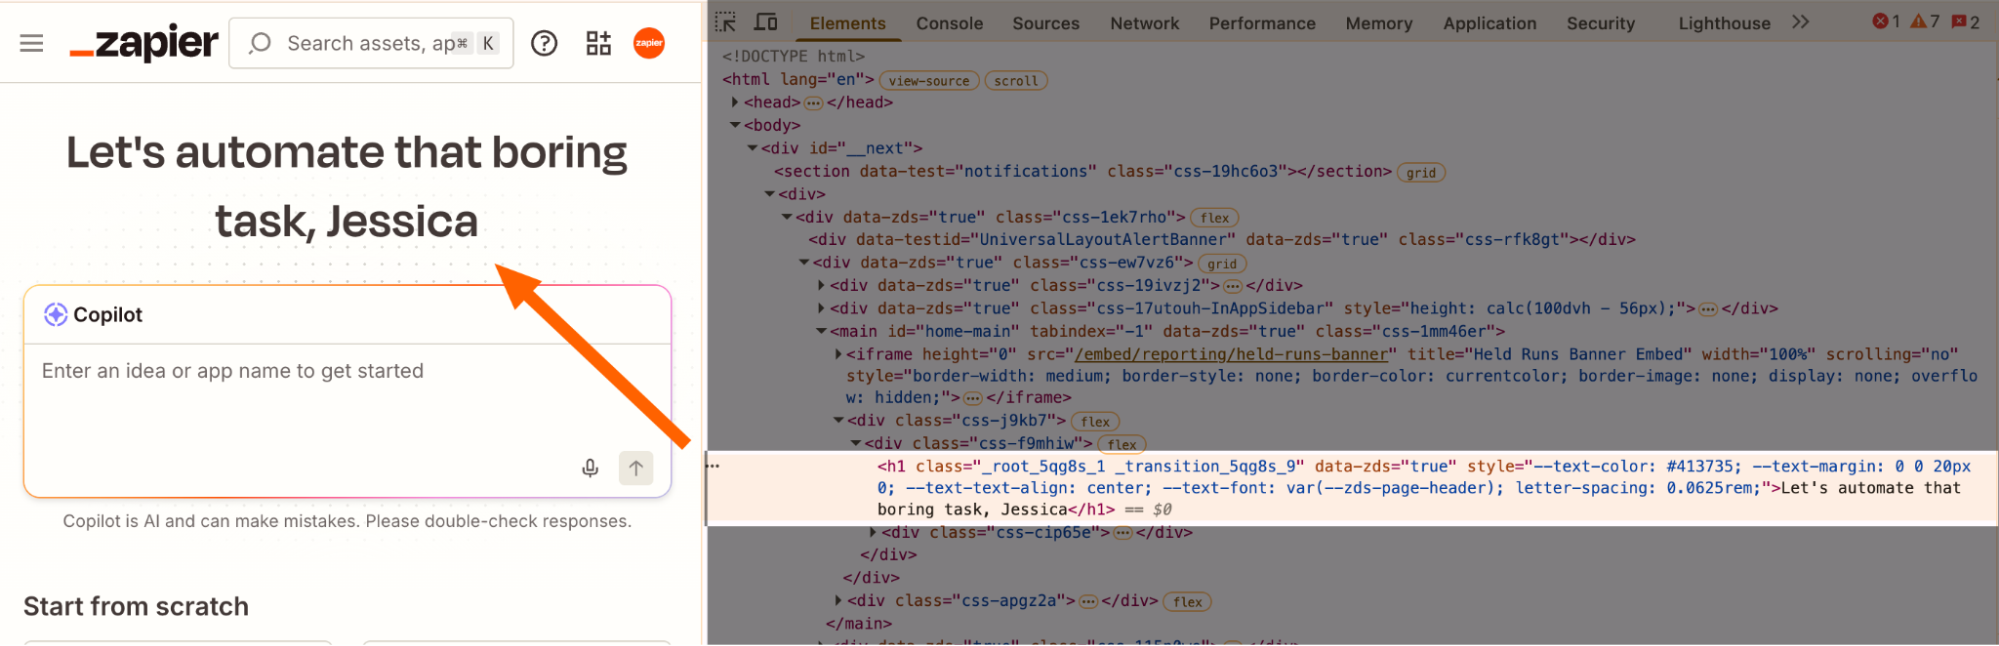
Hover over any line in the Elements tab, and the corresponding element will appear highlighted on the webpage. If you don't want to play the game of Guess which line is it anyway? there's an easier way: click the icon of an arrow on a dotted square in the top-left corner of the DevTools pane (Chrome and Firefox only), hover over anything on the page, and the corresponding HTML will highlight in the pane.

Safari doesn't have the same cursor icon, but you can use your keyboard shortcut to get similar functionality: command + option + C (Mac).
Here's what you can do with the Elements tab:
Edit text. Double-click any text node in the HTML pane to rewrite it. This works well for previewing copy changes in context before touching real code.
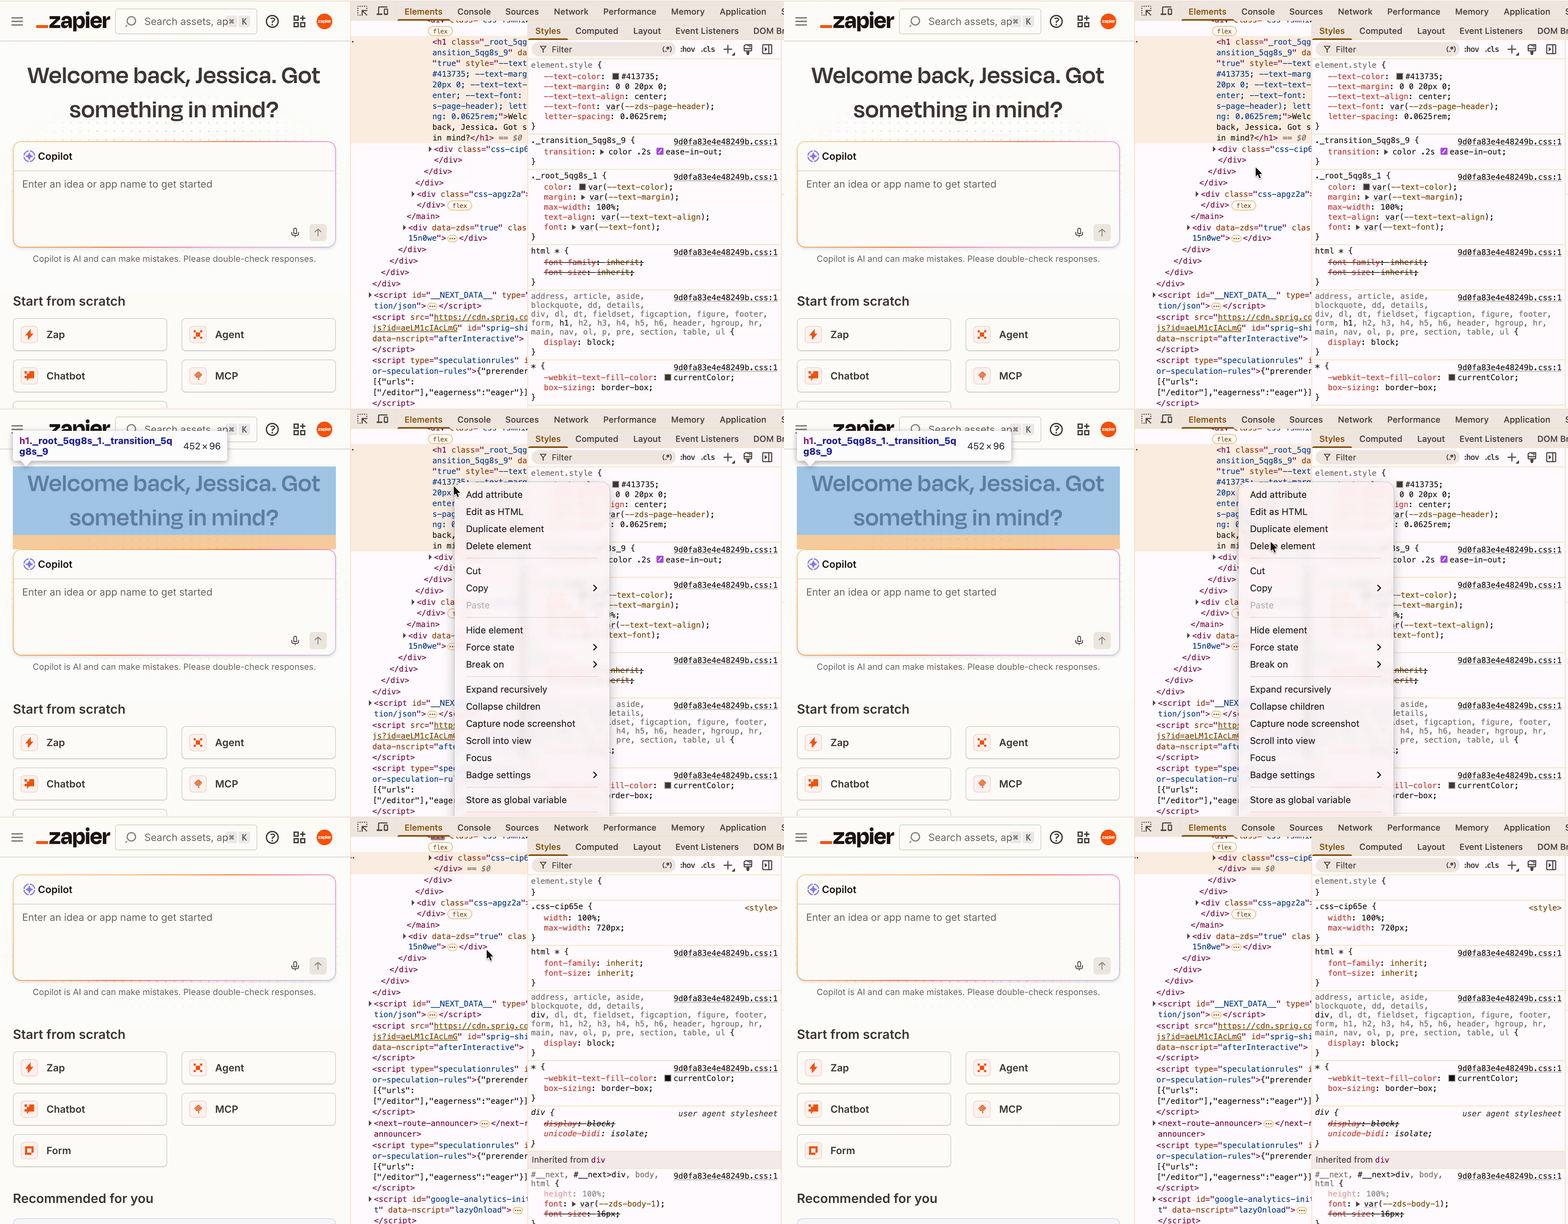
Tweak styles. Click an element and edit its CSS properties (color, padding, and font) in the Styles pane (it's another pane within your DevTools pane—usually on the right side).
Remove something from a screenshot. Right-click any element in the pane and select Delete element to temporarily hide it from the page.


Emulation: preview any device or screen size
You can also use Inspect Element to simulate how a page looks on any screen size—because you're designing your web page to be desktop and mobile friendly, right?
To open it, click the Toggle device toolbar icon (it looks like an outline of a phone overlapping with a laptop) in the top-left corner of the DevTools pane—or press command/Ctrl + shift + M. You can pick from preset devices or drag the viewport edge to any width you want.

Firefox calls this Responsive design mode. Toggle it with command + option + M (Mac) or Ctrl + Shift + M (Windows). Safari has it too, but it's accessed separately: click Develop in the menu bar (above your browser), and select Enter Responsive Design Mode or press control + Command + R.

Once you're there, here's what you can do with Device Mode:
Test a specific device. Select from a dropdown of preset devices to simulate their exact screen dimensions and pixel density.
Check breakpoints. Drag the viewport edge slowly across widths to see exactly where a layout shifts or breaks.
Simulate touch. Test how your page responds when users click buttons or swipe across the page.
Inspect Element keyboard shortcuts
Now that you've learned the ropes, here are some Inspect Element keyboard shortcuts that'll make using it even easier.
Chrome (Mac and Windows) | Firefox (Mac and Windows) | Safari (Mac only) | |
|---|---|---|---|
Open Inspect Element | command/Ctrl + Shift + C | command/Ctrl + Shift + C | command + option + I |
Toggle device/Responsive design mode | command/Ctrl + Shift + M | command/Ctrl + Shift + M | control + command + R |
Search current panel | command/Ctrl + F | command/Ctrl + F | command + F |
Open cross-file search | command + option + F / Ctrl + Shift + F | command/Ctrl + Shift + F | command + Shift + F |
Open/close drawer | Esc | Esc | Esc |
Hide selected element | H | H | H |
Increase / decrease value by 1 | ↑ / ↓ | ↑ / ↓ | option + ↑ / ↓ |
Increase / decrease value by 10 | Shift + ↑ / ↓ | Shift + ↑ / ↓ | option + Shift + ↑ / ↓ |
Inspect Element tutorial FAQ
Is Inspect Element legal?
Hopefully it felt so easy that it should be illegal, but yes, Inspect Element is completely legal. Just don't break the law by using Inspect Element for malicious purposes, like attempting to bypass paywalls or alter website data with harmful intent, which could have legal consequences. It all depends on how you use the information you find while using Inspect Element.
Can a website see when you inspect an element?
No, it can't. Everything you do within the safe space of Inspect Element is between you and your browser, so experiment away.
Does Inspect Element work on mobile?
Not directly. Mobile browsers don't have a built-in Inspect Element tool. But there's a workaround: connect your phone to a desktop computer via USB and inspect it remotely. Chrome on desktop can inspect pages open in Chrome on Android via chrome://inspect, and Safari on Mac can inspect pages open in Safari on iOS via the Develop menu.
If what you're really after is to preview how your page looks on mobile, you can emulate this from your browser.
What's the difference between Inspect Element and View Page Source?
View Page Source (command/Ctrl + U) shows you the raw HTML the server sent to your browser. It's a static snapshot of the page as it was delivered. Inspect Element shows you the page as it actually exists in the browser right now, including any changes made by JavaScript after the page loaded.
For a heavily dynamic page—like a social media feed of a single-page app like Gmail—View Page Source might look almost empty, while Inspect Element shows you everything actually on the page. For most everyday use cases, Inspect Element is the more practical of the two.
Related reading:
This article was originally published in January 2015 by Auri Pope and has also had contributions from Dylan Reber, Megan Orr, and Bryce Emley. The most recent update was in August 2026.