
There's a powerful tool hiding in your browser: Inspect Element.
Right-click on any webpage, click Inspect, and you'll see the innards of that site: its source code, the images and CSS that form its design, the fonts and icons it uses, the JavaScript code that powers animations, and more. You can see how long the site takes to load, how much bandwidth it used to download, and the exact color in its text.
Or, you could use it to temporarily change anything you want on the page.
Inspect Element is a perfect way to learn what makes the web tick, figure out what's broken on your sites, mock up what a color and font change would look like, and keep yourself from having to Photoshop out private details in screenshots. Here's how to use Inspect Element—your browser's secret superpower—to do all the above and more.
Most web browsers include an Inspect Element tool, while Microsoft's Edge browser includes a similar set of Developer Tools. This tutorial focuses on Inspect Element tools for Google Chrome, Mozilla Firefox, and Apple Safari, but most of the features work the same in other browsers like Brave.
Table of contents:
How to inspect element on Google Chrome
There are a few ways to access Google Chrome Inspect Element. Just open a website you want to try editing, then open the Inspect Element tool in one of these three ways:
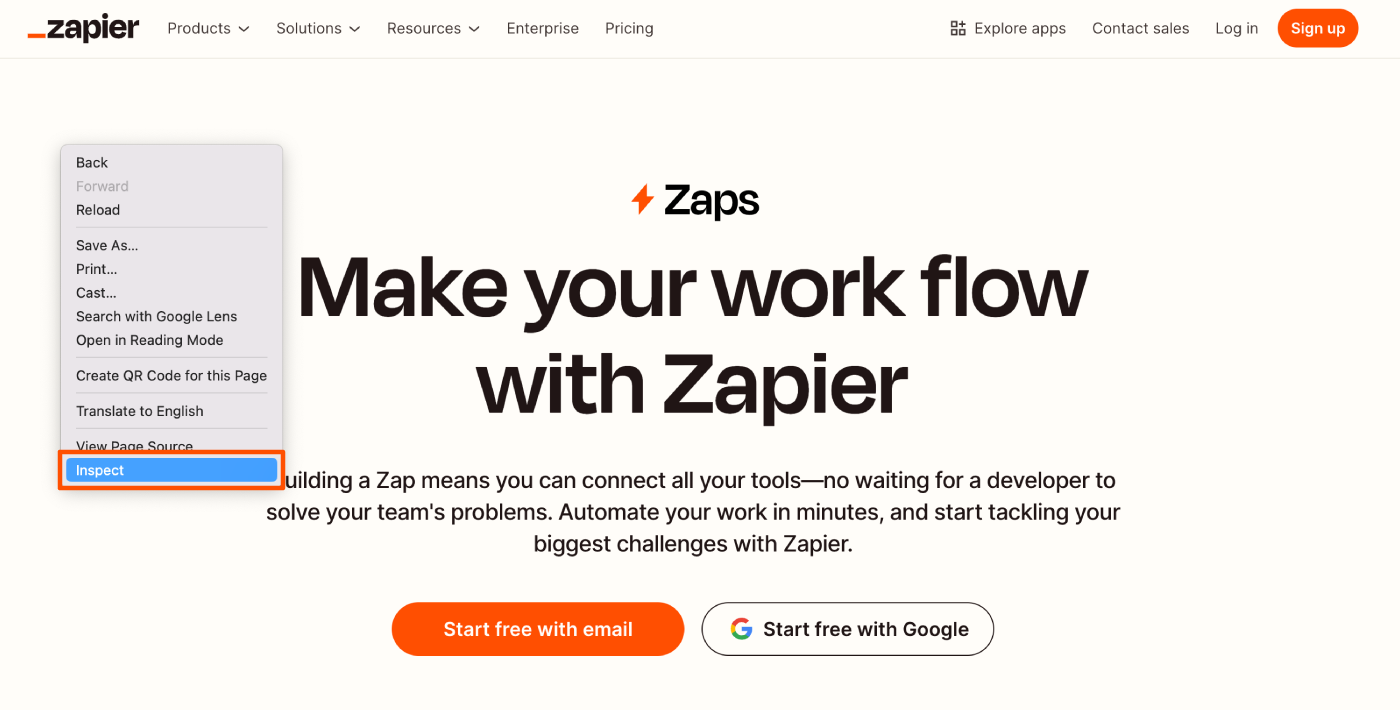
Method 1: Right-click anywhere on the webpage, and at the very bottom of the menu that pops up, click Inspect.
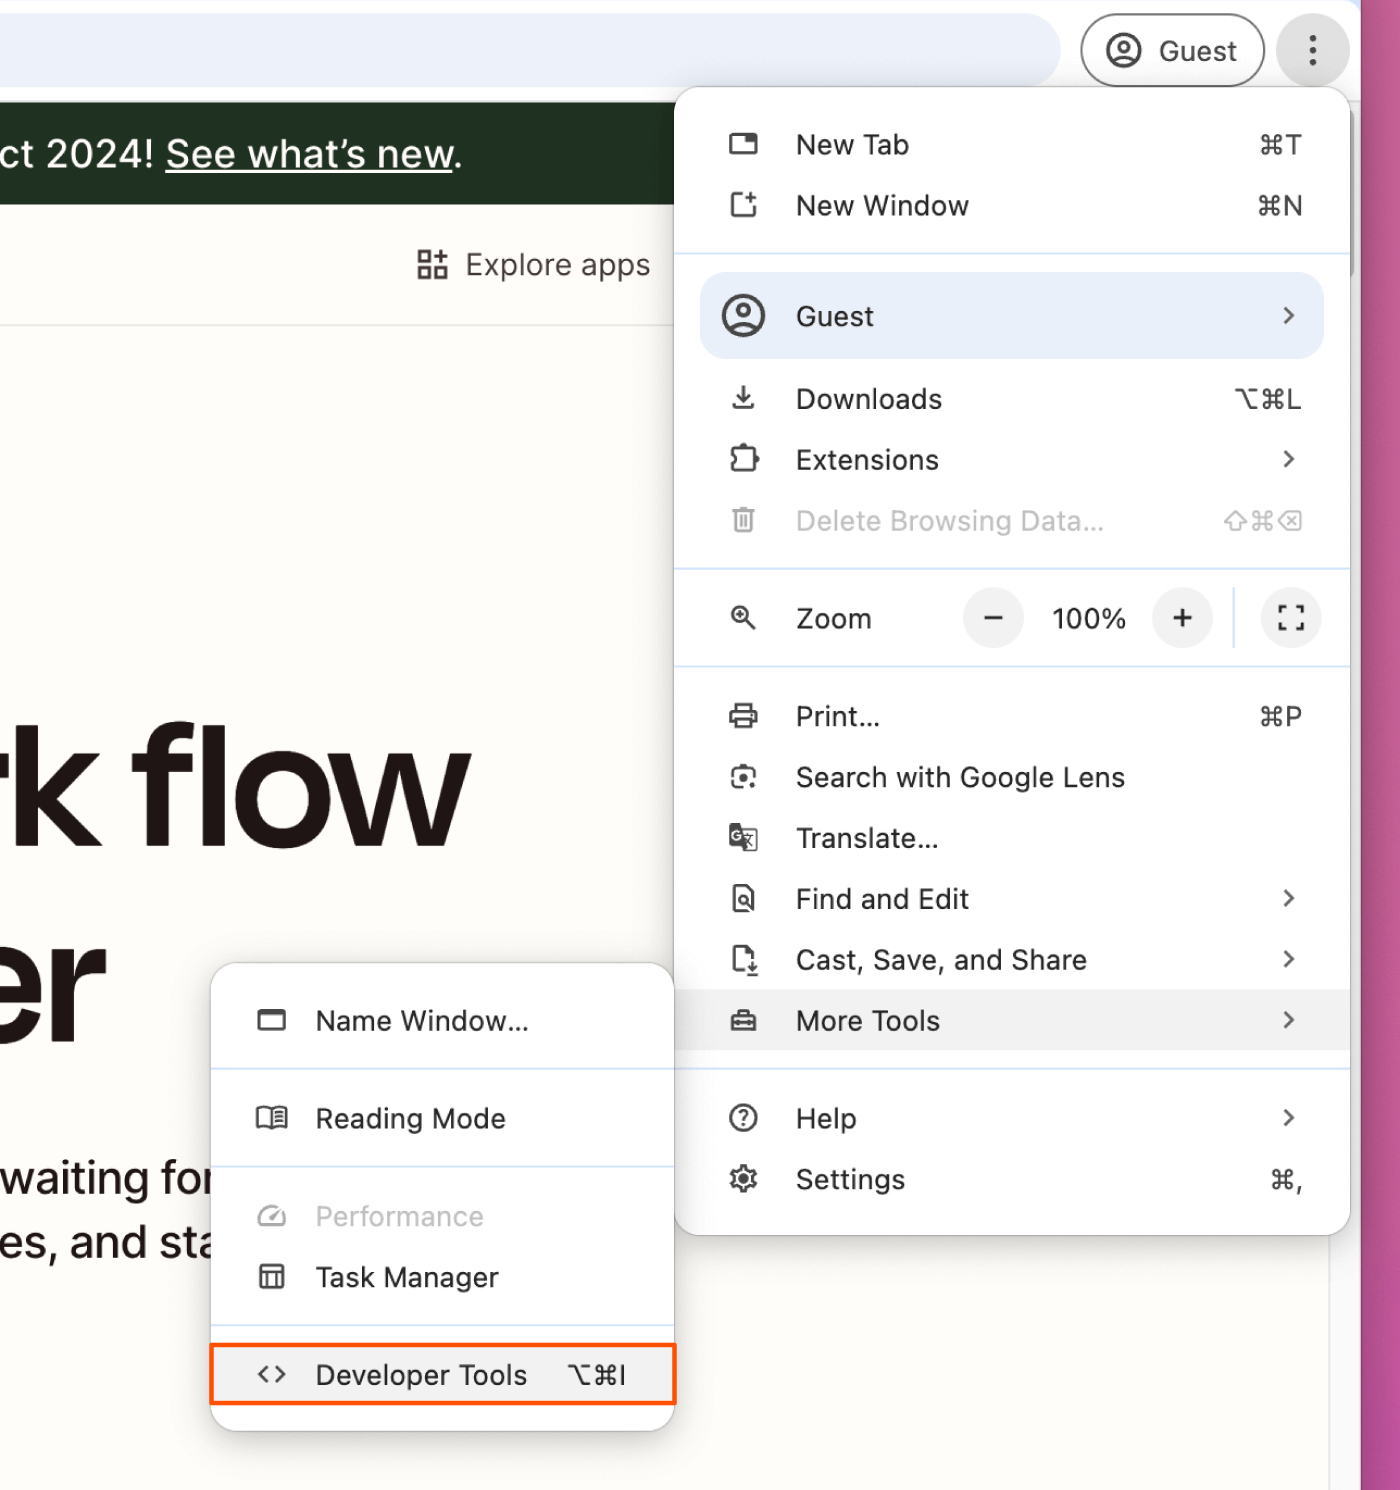
Method 2: Click the kebab menu (the icon with three stacked dots) on the far right of your Google Chrome toolbar, click More Tools, then select Developer Tools.
Method 3: Prefer keyboard shortcuts? Press
command + option + Ion a Mac, orCtrl + Shift + Con a PC to open Inspect Element without clicking anything.


Once you take your preferred route to opening the Developer Tools pane, by default, it will show the Elements tab—that's the famed Inspect Element tool we've been looking for.
If you want to change the orientation of the Inspect Element pane, click the three vertical dots on the top-right side of the Inspect Element pane near the X (which you'd click to close the pane). Now, you'll see options to move the pane to the bottom, left, or right side of your browser or to open the pane in a completely separate window (undock view).

For this tutorial, let's dock the pane on the right side of our browser window to give us more space to work. You can make the Developer Tools panel wider or narrower by hovering over the left-side border. Once the ↔ cursor appears, drag the pane left to widen it or right to narrow it.
How to inspect element on Firefox
To get to Inspect Element on Firefox you have three options (just like on Chrome).
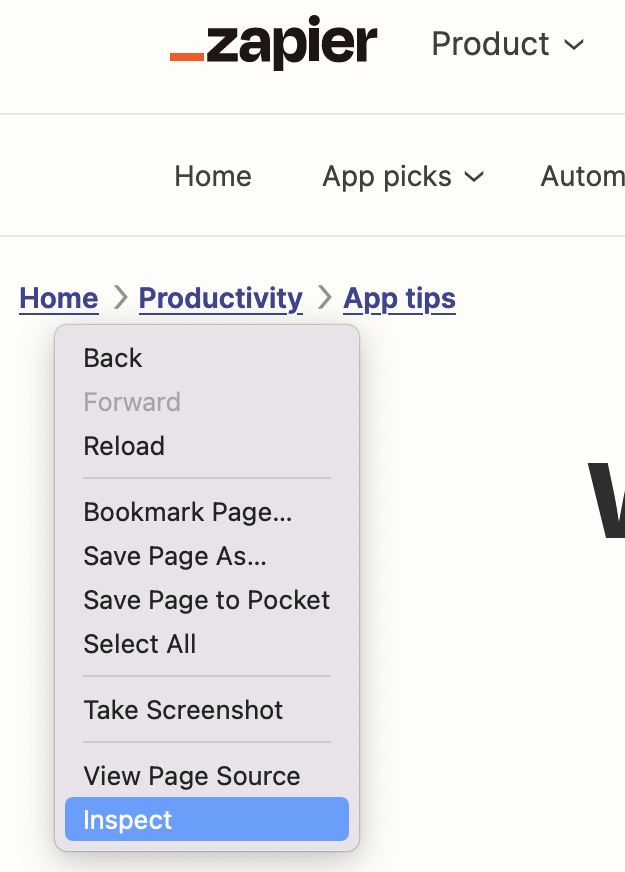
Method 1: Right-click anywhere on the page and click Inspect at the bottom of the menu.
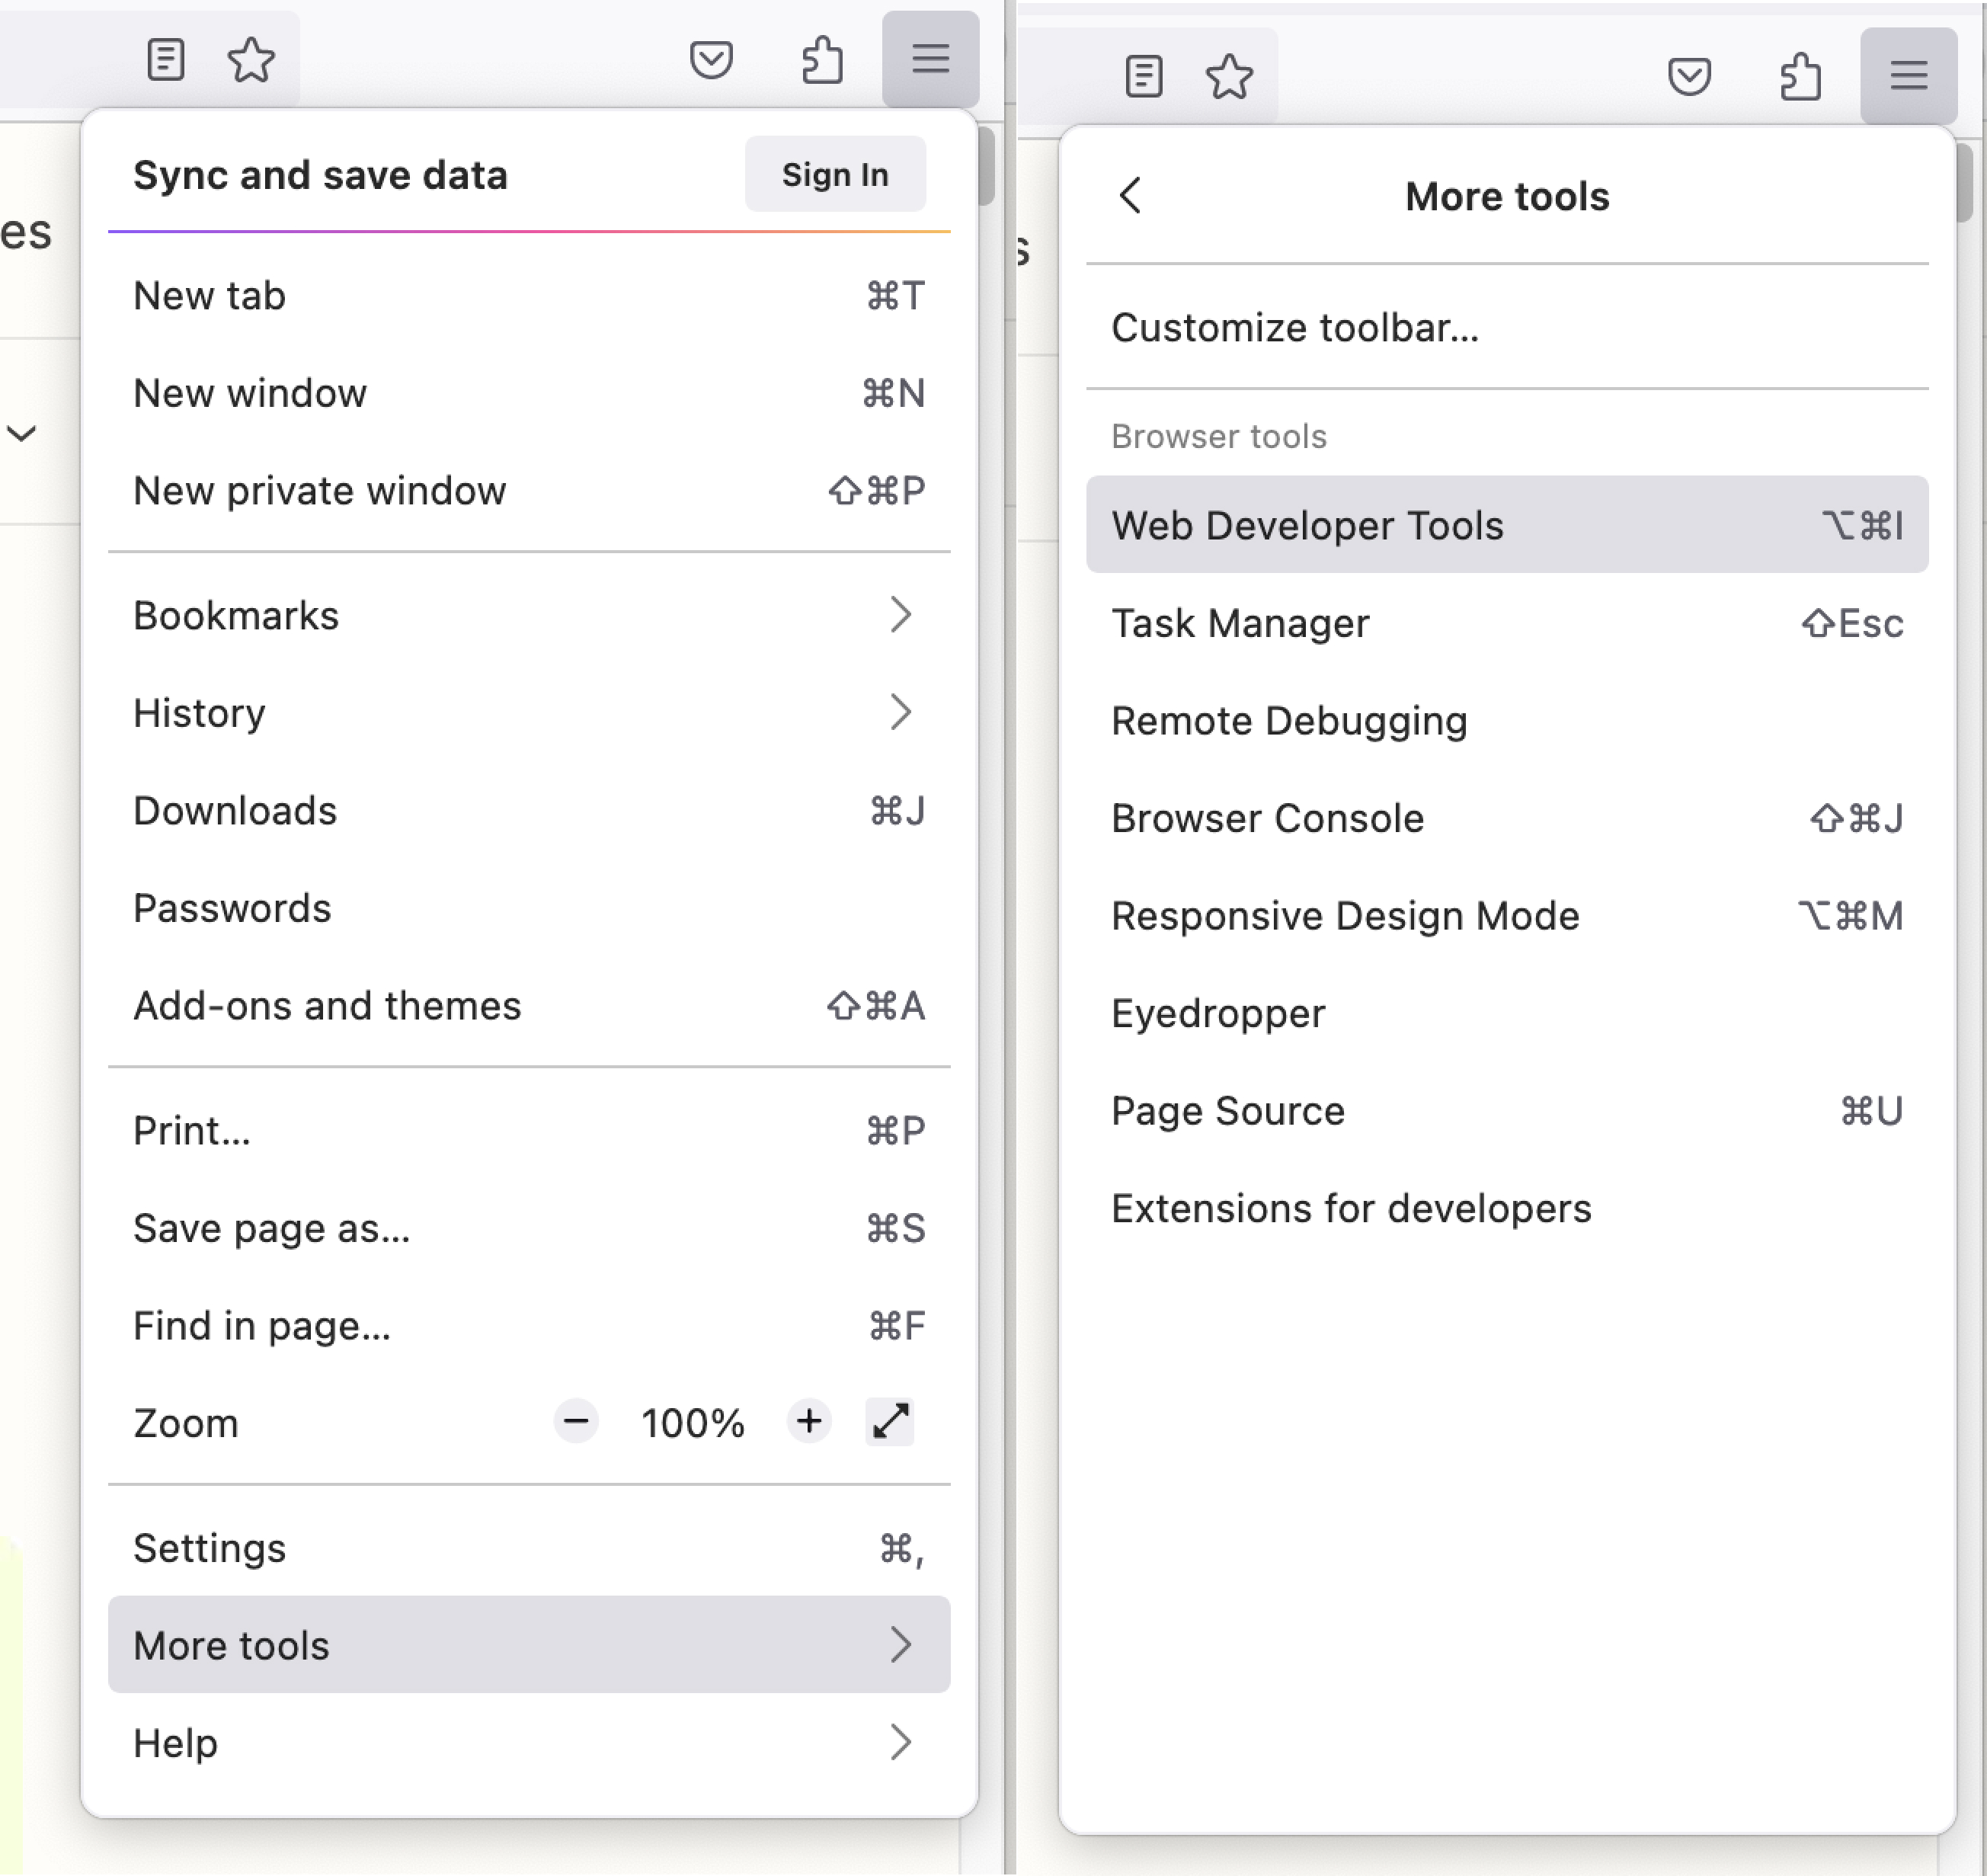
Method 2: Click the kebab menu (three horizontal lines at the top-right corner of the window), select More tools, then click Web Developer Tools.
Method 3: The keyboard shortcut on Firefox is
command + option + Ifor Macs andControl + Shift + Cfor PCs.


The Element pane in Firefox likes to pop up at the bottom of the window, which doesn't give you much room to work with. To move that pane to the side and free up more room, click the kebab menu (three horizontal dots, next to the X in the top-right corner) and click Dock to Right (or left, if you prefer).

If you like, you can also move the pane into a separate window. And you can expand the pane further or narrow it by hovering over the edge until your cursor changes, and then drag it to the left or right.
How to inspect element on Safari
To launch Inspect Element with Safari, you'll need to activate the developer capabilities in the advanced settings first. Here's how.
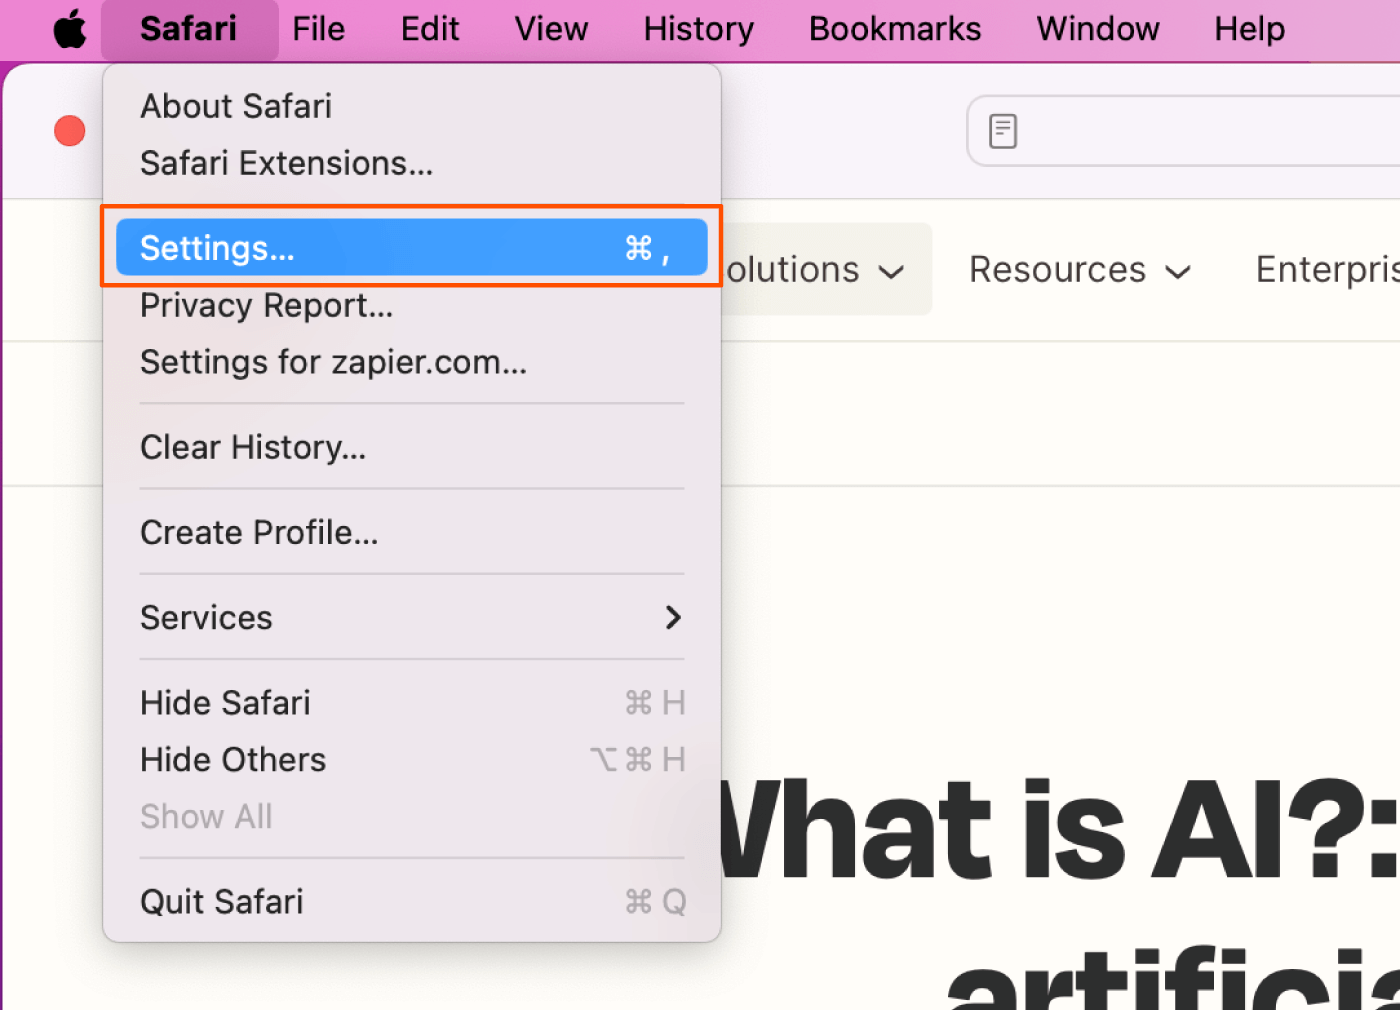
Click the Safari dropdown in the top navigation bar above the Safari window, and then click Settings.
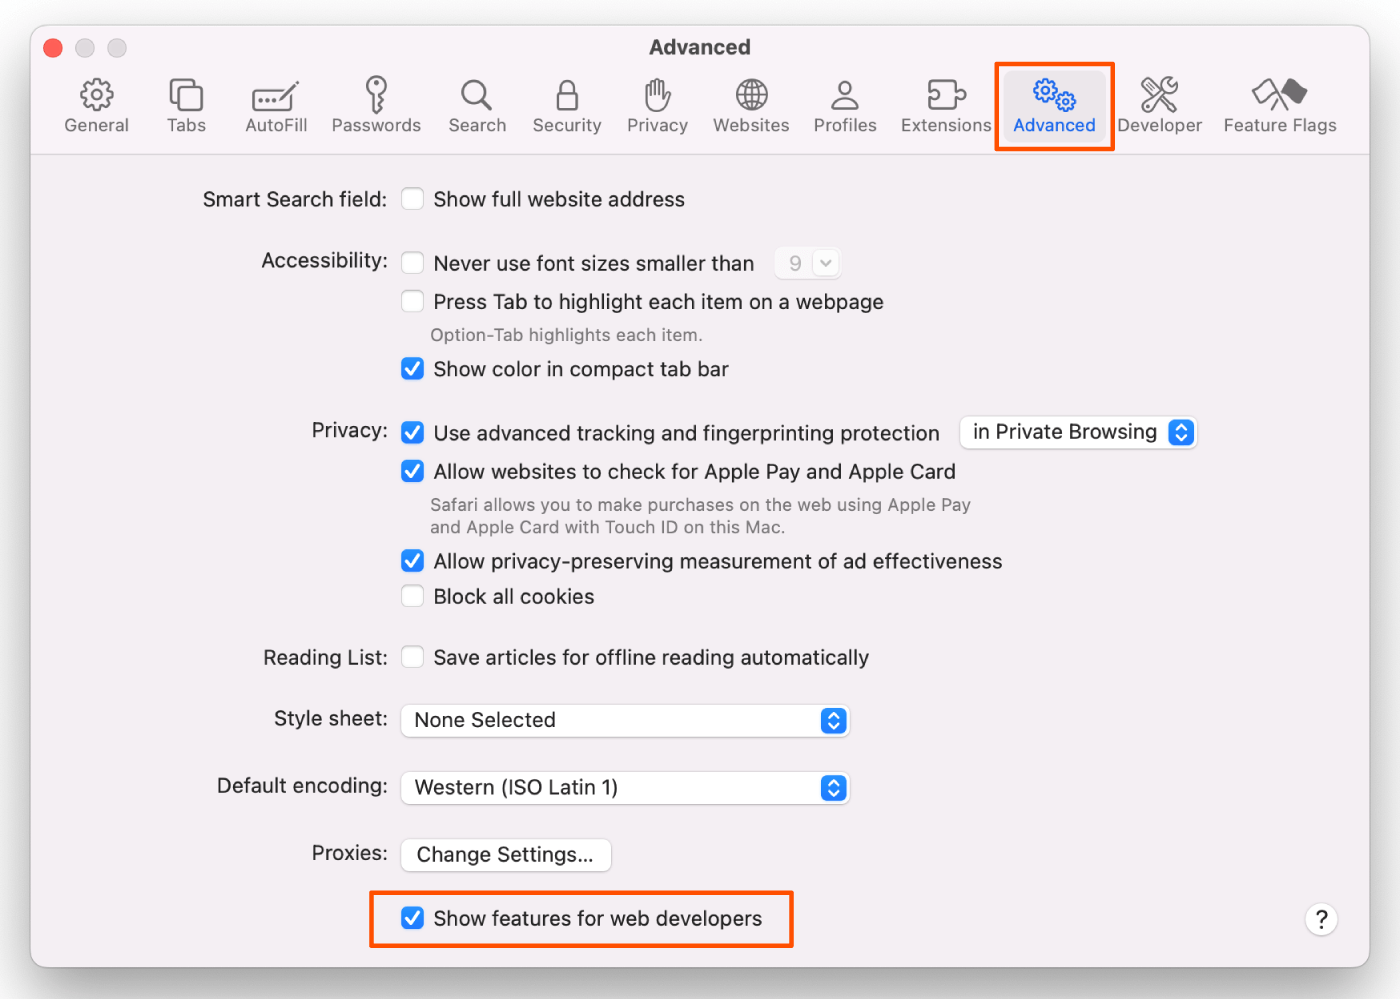
Navigate to Advanced, and check the box at the bottom of the window by Show features for web developers. Close the window.
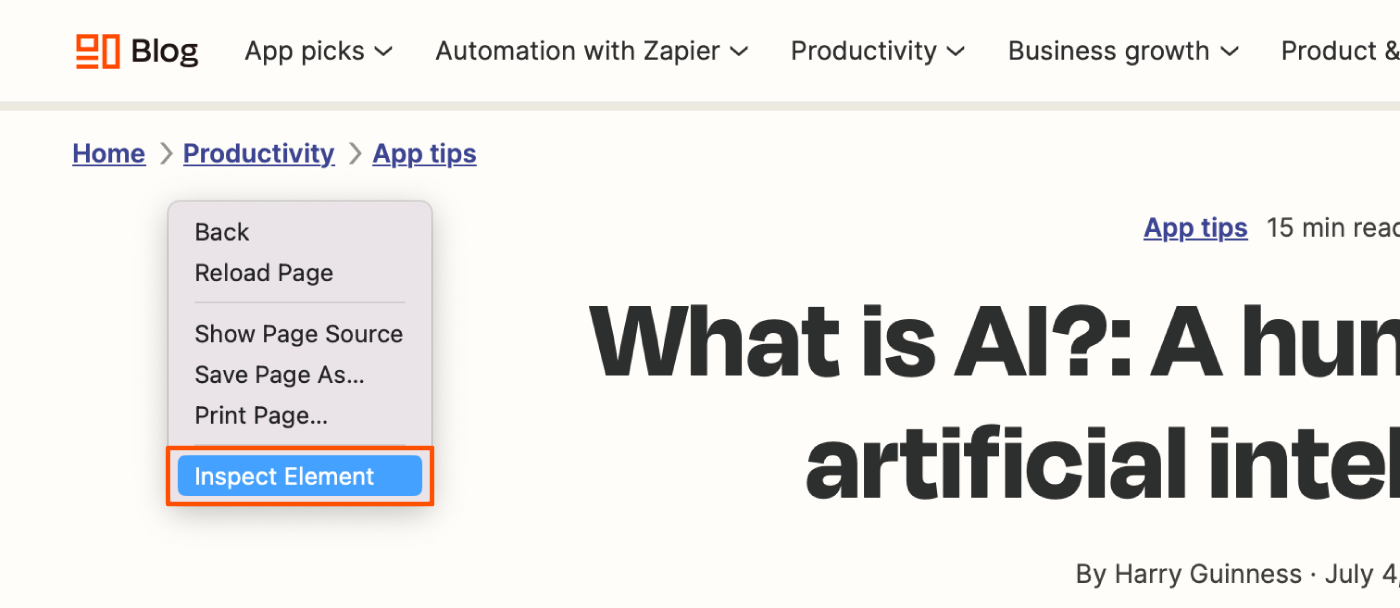
Now, you should be able to right-click anywhere on the page and click Inspect Element to open the Elements pane.
The pane should appear along the bottom of your window. To move it to a side alignment (or to go back to bottom alignment), click the Dock to right of window (or left of window or bottom of window) icon on the top-left corner of the pane. These icons are little clickable squares next to the X.
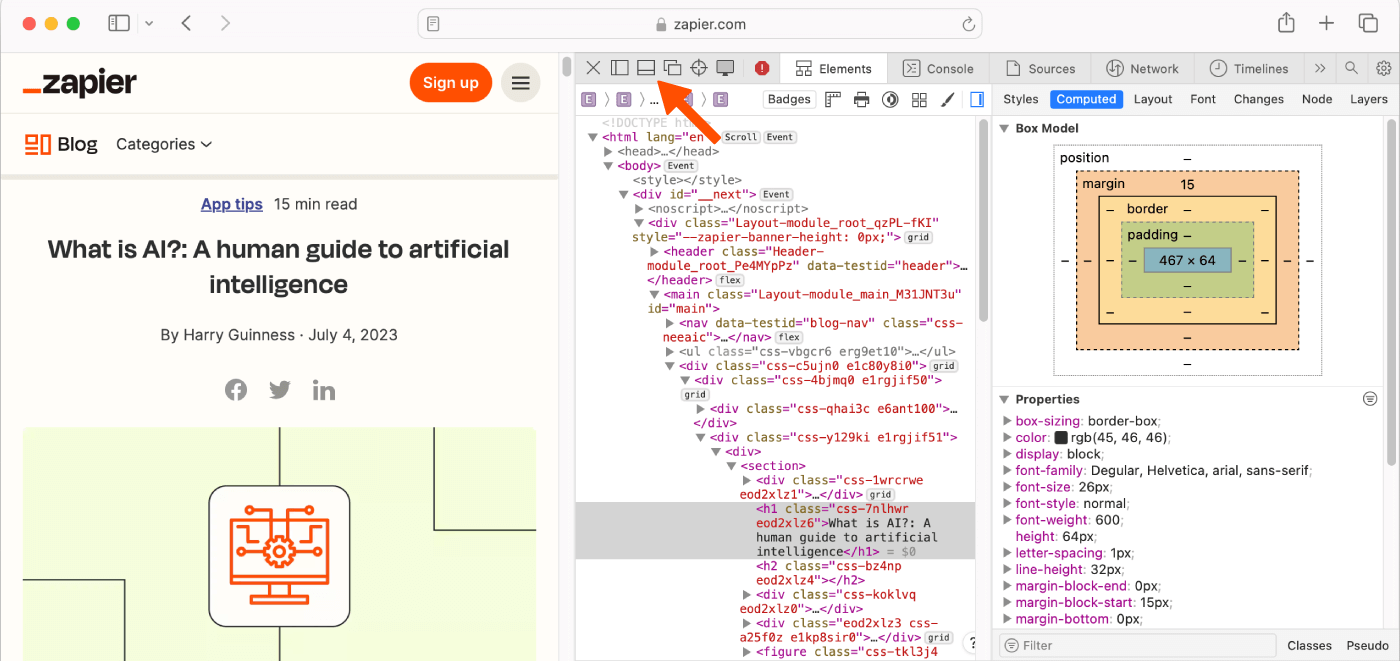


I prefer right, but you can easily switch this to the other side or detach the pane into its own separate window if you prefer. To make the pane wider or narrower, just hover over the edge until the cursor changes to the dragger, then drag to move the edge.
Tools you can access through Inspect Element (and tutorials for how to do them)
Now that we're in Inspect Element, there's an array of useful tools at our fingertips that we can use to make any site look exactly how we want. For this tutorial, we'll focus on the Search, Elements, and Emulation tabs. These aren't the only useful tools Inspect Element opens up—not by a long shot—but they're extremely helpful ones that beginners can start putting to use right away.
Note that, for simplicity, I'll be using Chrome to demonstrate, but the instructions should be essentially the same for all three browsers.
Use Inspect Element Search to find anything on a site
Wondering what goes into your favorite sites? Search is your best tool for that, aside from reading a site's entire source code.
You can open the default Elements view, press Ctrl + F or command + F, and search through the source code. But the full Search tool will also let you search through every file on a page, helping you find text inside CSS and JavaScript files or locate an icon image you need for an article.
To get started, open Zapier's blog article on "What is AI?" in Chrome, then open Inspect Element, click the kebab menu, and select Search. The Search tab will appear on the bottom half of the Developer Tools pane.

In the search field, you can type anything—anything—that you want to find on this webpage, and it will appear in this pane. Let's see how we can use this.
Type meta name into the search field, press Enter or return, and you'll immediately see every occurrence of "meta name" in the code on this page. Now, you can see this page's metadata, the SEO keywords it's targeting, and whether or not it's configured to let Google index it for search. That's an easy way to check what your competitors are targeting—and to make sure you didn't mess anything up on your site.

Search is an effective tool for designers as well since you can search by color, too. Type #ff4a00 into the search field, and press Enter or return. You should now see every time the color #ff4a00, Zapier's shade of orange, appears in this site's CSS and HTML files. Then, just click a line containing "#ff4a00" to jump to that line in the site's HTML.

This is a handy way for designers to make sure a site is following their brand's style guide. With the Search tool, designers can easily check the CSS of a webpage to see if a color is applied to the wrong element, if an incorrect font family is used on a webpage, or if you're still using your old color somewhere on your site.
The Search tool is also the perfect way to communicate with developers better since you can show them exactly where you've found a mistake or exactly what needs changing. Just tell them the line number where the problem exists, and you'll get your fix that much quicker.
Change anything on a web page with the Elements tab
Front-end developers use the Inspect Element tool every day to modify the appearance of a webpage and experiment with new ideas—and you can, too. Inspect Element lets you tweak the appearance and content of a webpage by adding temporary edits to the site's CSS and HTML files.
Once you close or reload the page, your changes will be gone; you'll only see the changes on your computer and aren't actually editing the real website itself. That way, you can feel free to experiment and change anything—and then copy and save the very best changes to use later.
Let's see what we can do with it.
Click the Elements tab in the Developer Tools pane—and if you want more room, tap your Esc key to close the search box you had open before. You should see the HTML for this page—now you know how the sausage gets made.

In the top-left corner of the Developer pane, you'll see an icon of an arrow on top of a dotted square. Click it, then you can select any element on the page you want to change. So let's change some things!
Change the text on a webpage
Ever wanted to change text on a site? Perhaps to see how a new tagline would look on your homepage or to take your email address off a Gmail screenshot? Now you can.
Click the icon of an arrow on a dotted square in the top-left corner of the pane.
Hover over any text on the page (like the copy on our "What is AI?" blog), which will correspond with a blue highlight over the related code.
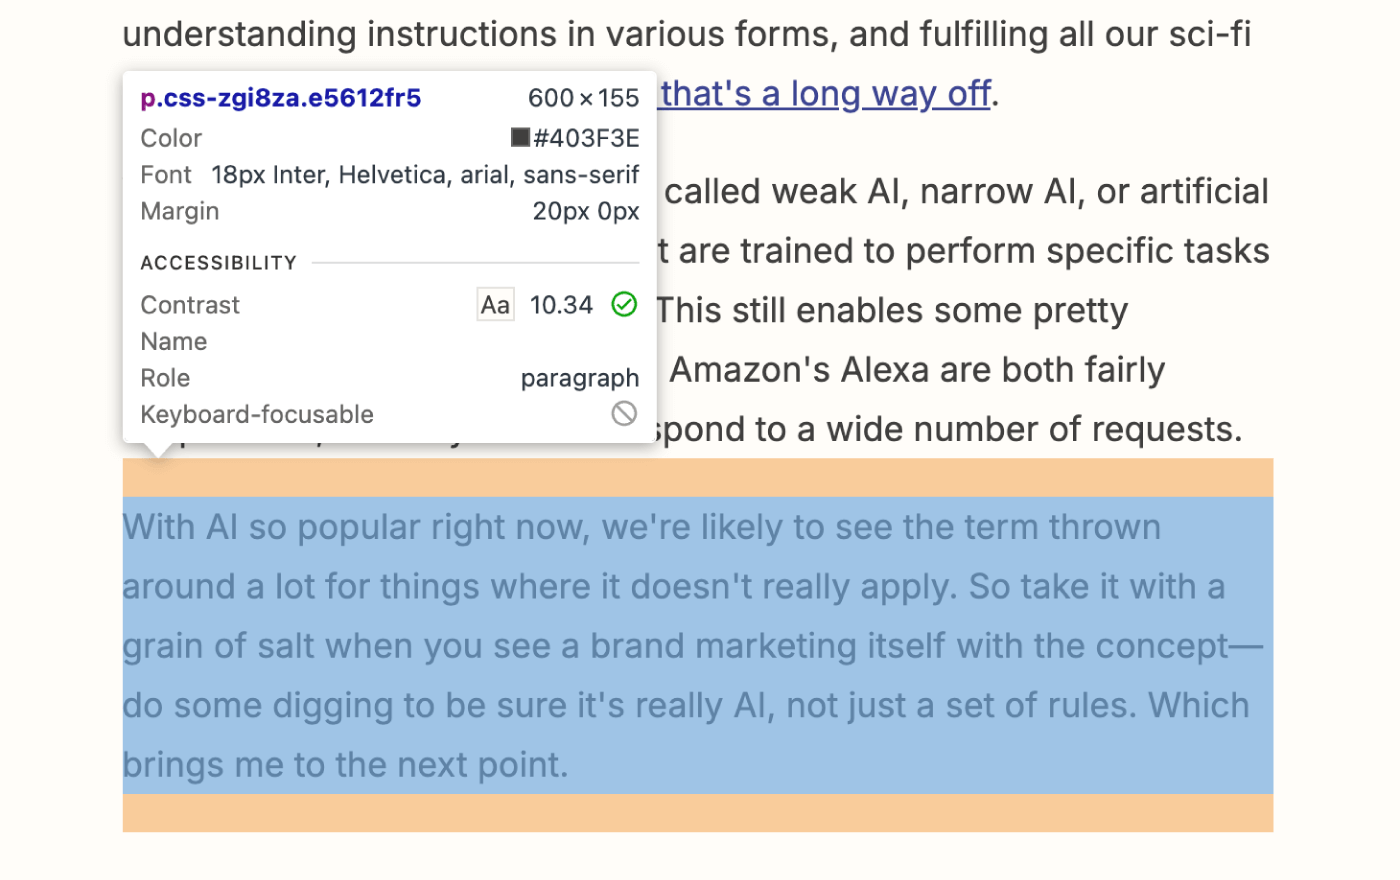
Click the highlighted text on the live page. In the Developer Tools pane, click the little arrow that precedes the highlighted line of HTML to turn it into an editable text field.
Type anything you want in this text field, and press Enter or return.


Voila! You've just (temporarily) changed the text on the webpage.

Refresh the page, and everything will go back to normal.
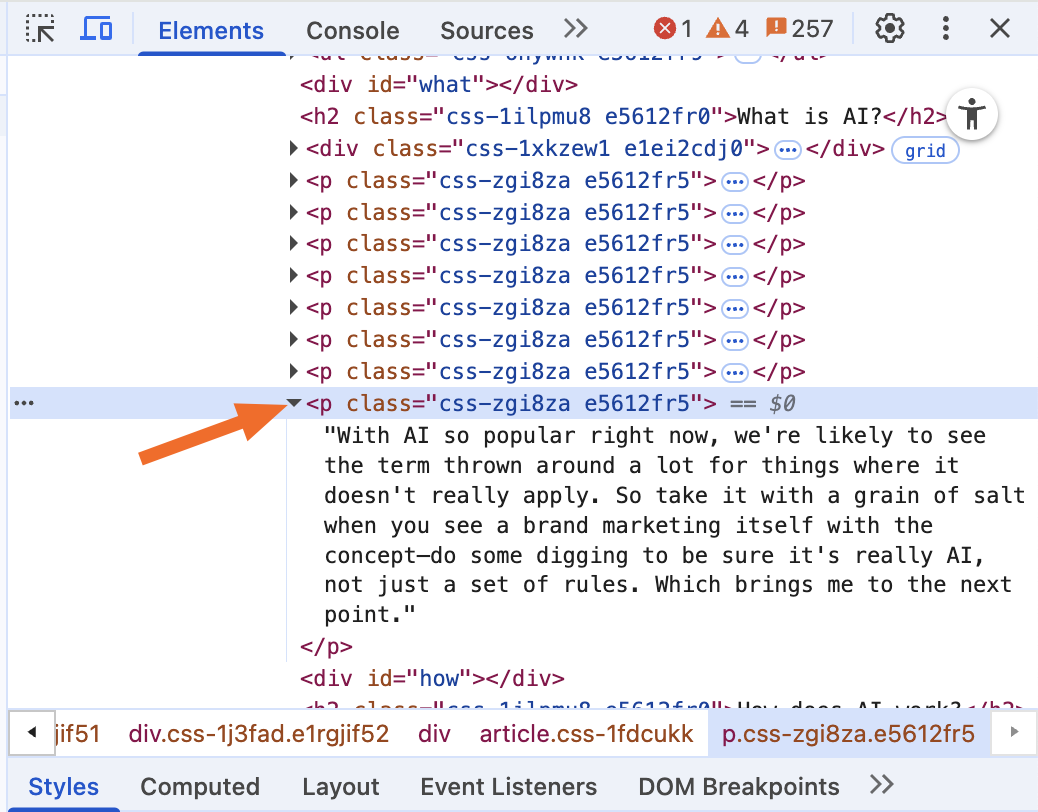
Fun? Let's try another way to change some things on this page by closing out of the Developer pane altogether. You can then highlight any part of the live webpage you want to edit, then right-click it, and hit Inspect.

When your Developer Tools pane opens, it should automatically highlight the line of HTML. Pretty neat, huh? It's the little things that count.
Now that we've selected a sentence to edit on our blog, let's change how it looks.
Change the color and font of elements
On the lower half of the Developer Tools pane (or the right half, depending on how wide your pane is), you'll see a sub-pane with a few additional tabs that allow you to change how this text looks on the page. Let's get started on the Styles tab.

You may notice that some things are crossed out. This means that these styles are not active for the element we've selected, so changing these values will have no effect.
Let's try changing something.
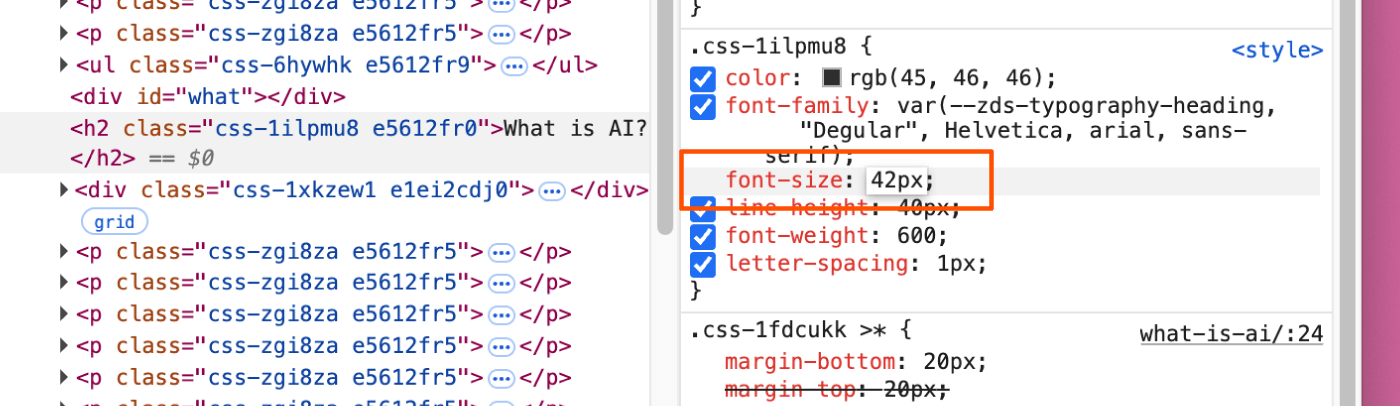
Highlight the header "What is AI?" and click Inspect.
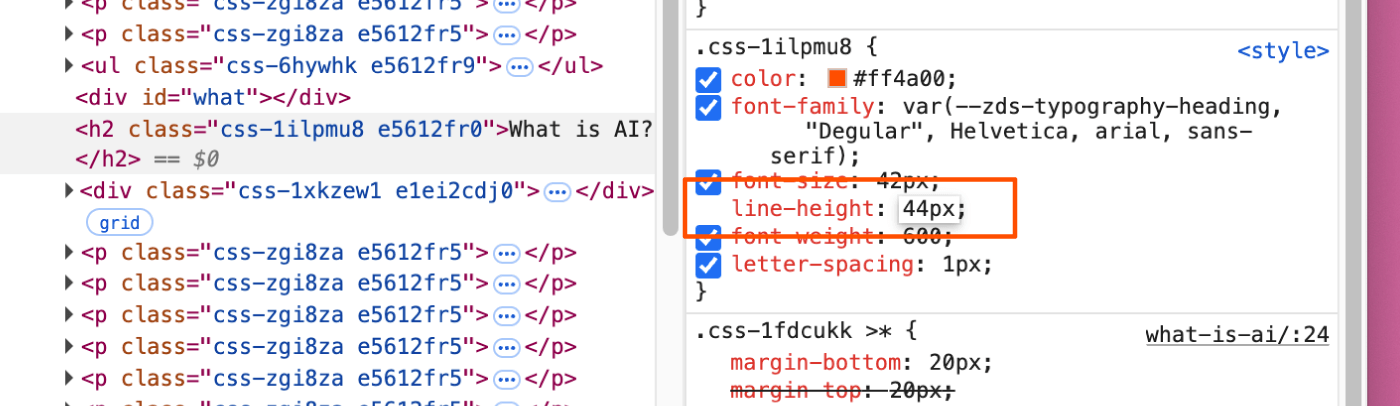
Under Styles, look through the code for the "font-size" field and click into it. Let's change it from 34px to 42px.
Now scroll down to "color" and change it to Zapier's signature #ff4a00.
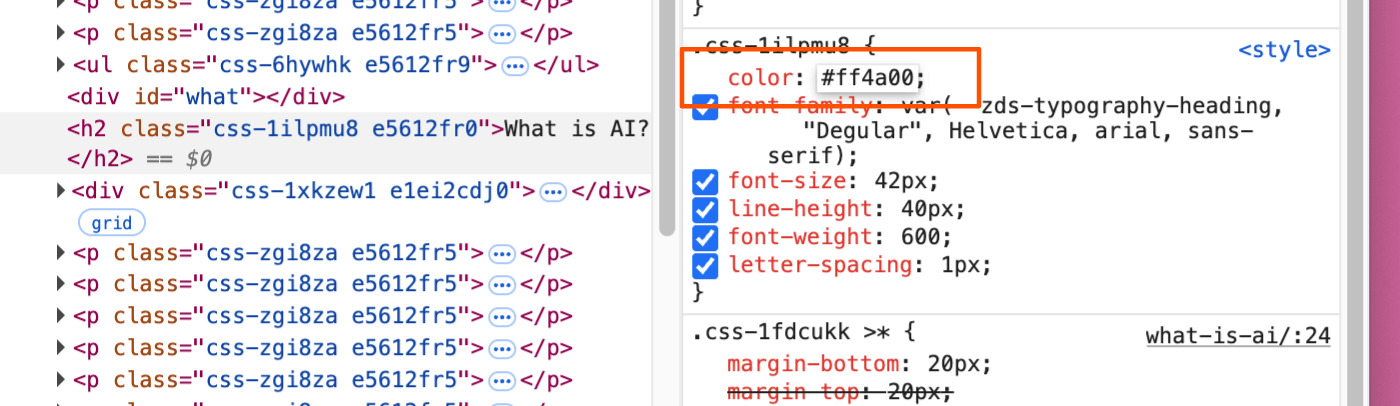
This will look a bit cramped, so let's finish by changing the "line-height" to 44px.
Now check the blog post to see the difference.


Now let's try something really cool.
Change element states
Want to see how a button or link will look once someone interacts with it? Inspect Element can show that, too, with force element state tools. You can see how the element will look once a visitor hovers over the element (hover state), selects the element (focus state), and/or has clicked that link (visited state).
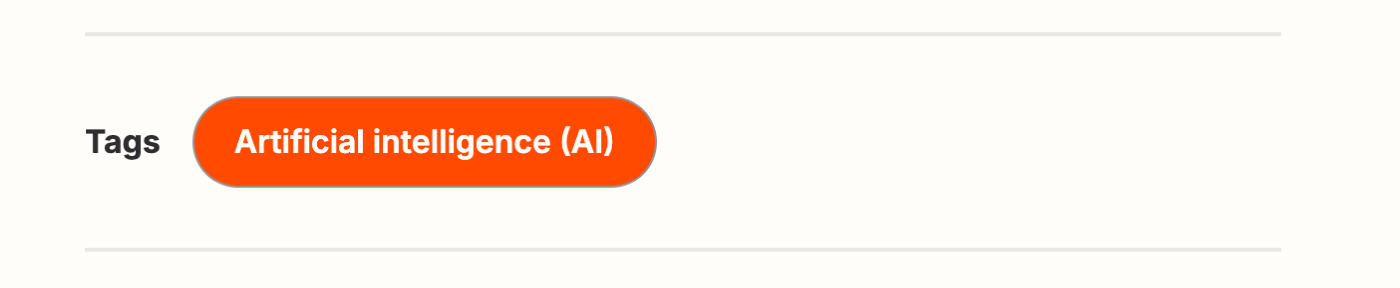
As with the other examples, you'll need to click the arrow cursor/dotted square. For this example, we'll select the "Artificial Intelligence (AI)" tag at the bottom of the "What is AI" article to try a color change.
Highlight the text of the tag, and click Inspect.
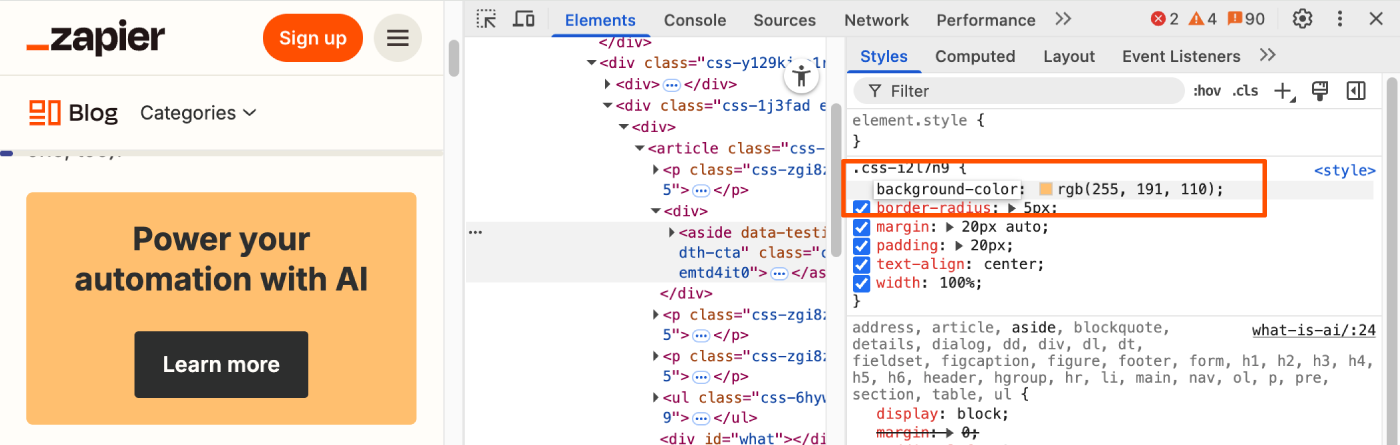
In the Developer Tools pane, right-click on that code in the Elements tab, hover over Force state, and click the :hover: option.
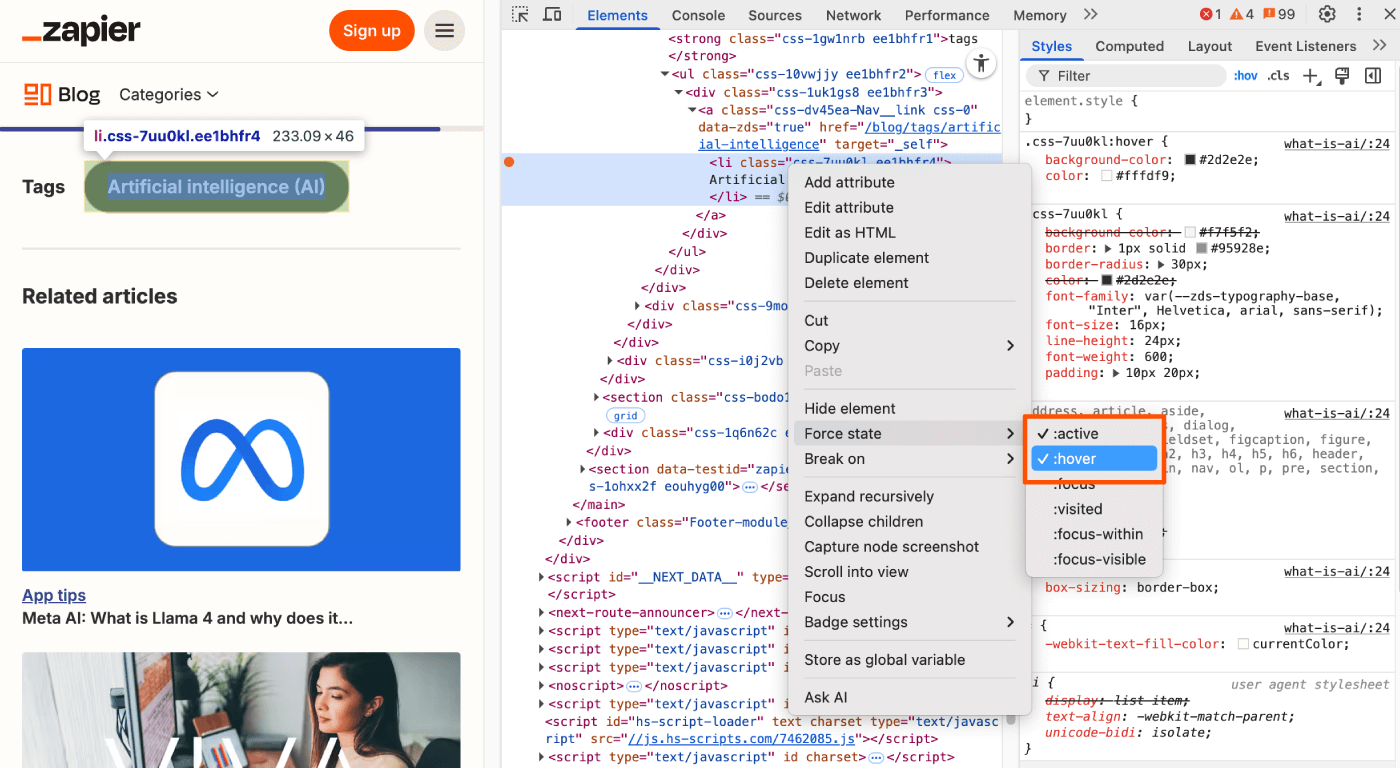
That will change the button's background to black, which is what happens when you hover over the button on the live site.
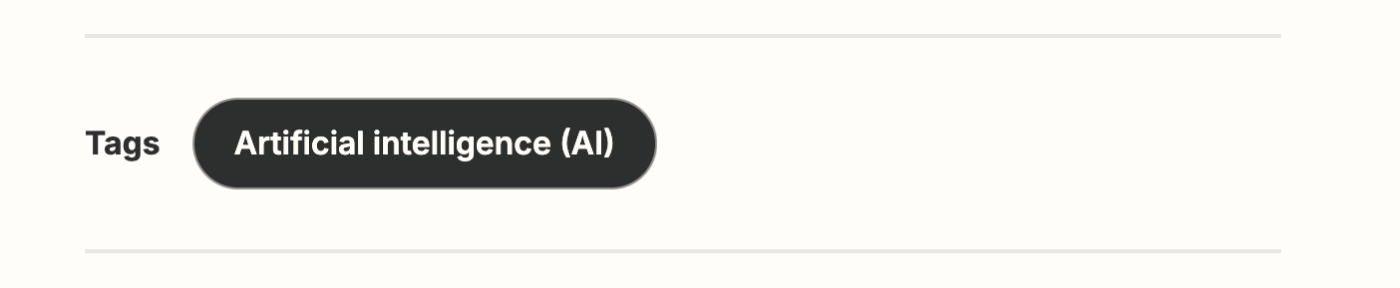
Now, change the "background-color" value to #ff4a00.
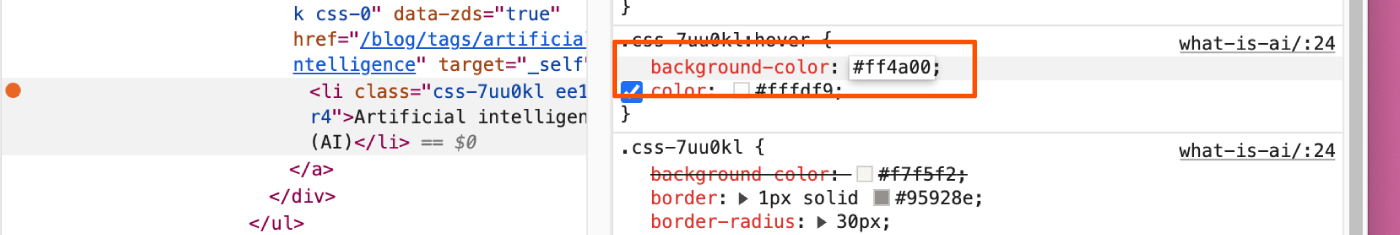
You should instantly be able to see what the new hover color will look like.


Try experimenting—change the :hover: color, then uncheck :hover: in the right-click menu and drag your mouse over the button to see the new button color.
Change images
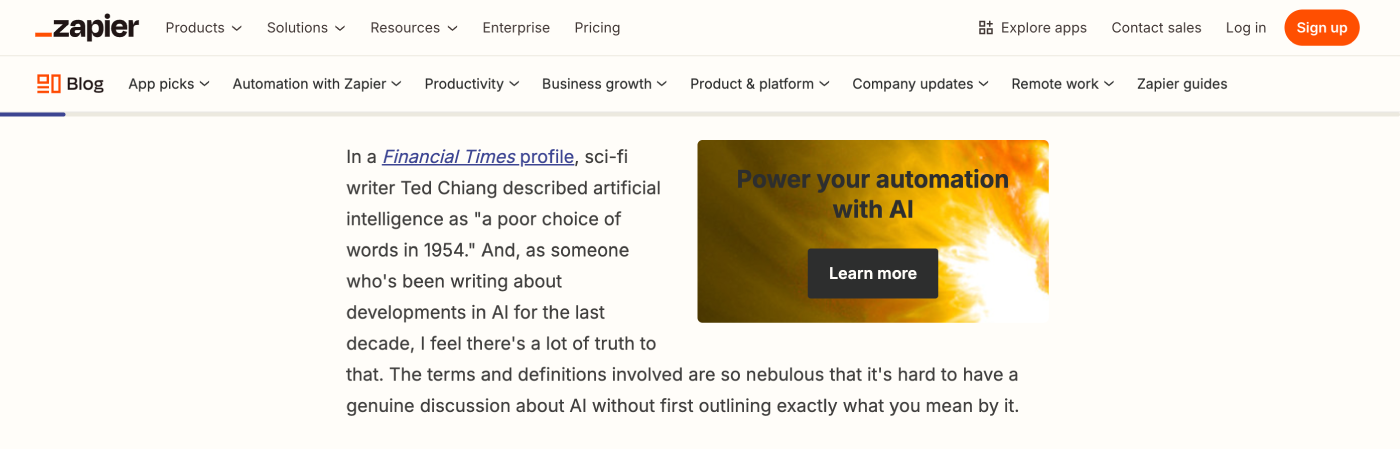
You can easily change images on a webpage with Inspect Element, too. Using the same "What is AI?" blog post as an example, let's replace the orange solid color background on the "Power your automation with AI" button with a dramatic photo of a solar flare from NASA.
First, copy this link to the image: https://c1.staticflickr.com/9/8314/7931831962_7652860bae_b.jpg
Open Inspect Element on the orange background of the "Power your automation with AI" button and look for the "background-color" code in the pane.
Click "background-color" and replace
colorwithimage—this should cause an error. That's ok. Now replacergbwithurland then paste the URL you copied into the parentheses (replace anything that's in the parentheses already).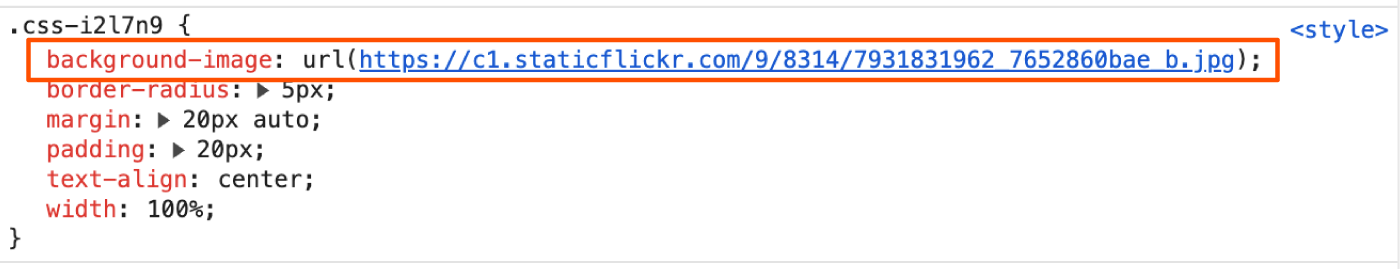
This should automatically replace that boring single-color background with a flashy new image.


Note: You can also change a photo to a GIF or a video—all you need is a link to the file, and you can add it in.
Editing text is handy, swapping out images is fun, and changing colors and styles just might help you quickly mock up the changes you want made to your site. But how will that new tagline and button design look on mobile?
That's where Emulation comes in—it's where everything we've reviewed so far can be applied even further. Let's see how.
Test a site on any device with the Emulation tab
Everything has to be responsive today. Websites are no longer only viewed on computers—they're more likely than ever to be viewed on a phone, tablet, TV, or just about any other type of screen. You should always keep that in mind when creating new content and designs.
Emulation is a great tool to approximate how websites will look to users across various devices, browsers, and even locations. Though this does not replace actual testing on a variety of devices and browsers, it's a great start.
In the Developer Tools pane, you'll notice a little phone icon in the top-left corner. Click it. This should change the page into a tiny, phone-styled page with a menu at the top to change the size.

Resize the small browser to see how things would look if you were browsing on a tablet, phone, or even smaller screen. Or, click the Dimensions button at the top to select default device sizes like Surface Duo or iPhone 14 Pro Max—let's go ahead and select the latter.
The webpage screen should shrink down to the device's size, and you can zoom in a bit by clicking the percentage dropdown next to the dimensions.
If you change the device preset to "Responsive" (instead of one of the device names), you can enlarge the view by dragging the right edge of the webpage emulation to the right. See what happens? Dragging the screen along the grid allows you to see how the webpage will change as the screen size changes. You can even toggle portrait and landscape views by clicking the little rotation icon at the end of the top menu.
Play around with the other devices to see how the webpage and screen resolution changes. All of the other developer tools we've gone over so far will also react to the device view.
Emulate mobile device sensors
When you start interacting with a device preview, you may notice that your mouse now appears as a little circle on the webpage. This allows you to interact with the page as if you're on your mobile device.
If you click while dragging the page down, it doesn't highlight text like it normally would in your browser—it drags the screen down like you're on a touchscreen device. Using this view, you can see how large touch zones are on a webpage. This means you can see which buttons, icons, links, or other elements are easily touchable with the finger.
You can even make your browser act like a phone. Press your Esc key to open the Search pane in Inspect Element again, and this time click the kebab menu on the top-right. Select More tools and then Sensors to get six new tools: Location, Orientation, Touch, Emulate Idle Detector state, Hardware concurrency, and CPU Pressure.

Touch lets you choose whether the circle selector that acts more like a finger than a normal mouse cursor is forced or device-specific.
Orientation lets you interact with motion-sensitive websites, such as online games that let you move things by moving your phone.
Location lets you pretend you're in a different location.
Emulate Idle Detector state allows you to toggle between different idle user conditions.
Hardware concurrency lets you simulate different levels of device processing power.
CPU Pressure allows you to emulate different levels of CPU stress on a webpage.
Let's try viewing this site from Berlin. Just click the dropdown and select the city—nothing changes, right?

This is because there isn't content on this page that changes based on your location. If you change the coordinates on a site like Groupon.com that uses your location to show localized content, though, you would get different results. Go to Google.com in a different location, and you'll perhaps see a new Google logo for a holiday in another country, or at least will get the results in a different language.
Emulation is a great way to put yourself in your user's shoes and consider what the user may be seeing on your webpage—and it's a fun way to explore the international web.
Emulate mobile networks
You can also see what it's like to browse a site on different networks—perhaps to see if your site will load even if your users are on a slower 3G network.
To give it a try, click the kebab menu in the top-right corner of the pane, hover over More tools, and select Network conditions.

There, click the dropdown next to Network throttling, and you can choose from fast or slow 4G, 3G, or offline to see how the page works without internet. Or, click Add... to include your own testing (perhaps add 56Kbps to test dial-up internet). Now, reload the page, and you'll see just how long it'd take for the site to load on a slow connection—and how the site looks while it's loading. That'll show why you should improve your site to load faster on slow connections.

You can also change your user agent—uncheck Use browser default in the User agent field and select Firefox — Mac to see if the site changes its rendering for other browsers on different devices. That's also a handy hack to make webpages load even if they claim they only work in a different browser.
This is by no means a complete list of things you can do with Inspect Element. As you start exploring, you'll see many more features. My advice: click all the buttons.
Why should I use Inspect Element?

If you've never peeked at a website's code out of curiosity, you might wonder why you should learn how to use Inspect Element. Below are just a few reasons why different roles can benefit from learning this trick of the trade.
Designer: Want to preview how a site design would look on mobile? Or want to see how a different shade of green would look on a sign-up button? You can do both in seconds with Inspect Element.
Marketer: Curious what keywords competitors use in their site headers, or want to see if your site's loading too slow for Google's PageSpeed test? Inspect Element can show both.
Writer: Tired of blurring out your name and email in screenshots? With Inspect Element, you can instantly change any text on a webpage.
Support agent: Need a better way to tell developers what needs to be fixed on a site? Inspect Element lets you make a quick example change to show what you're talking about.
Web developer: Need to look for broken code, compare layouts, or make live edits to a page? Inspect Element does that, too.
For these and dozens of other use cases, Inspect Element is a handy tool to know.
Inspect Element keyboard shortcuts
Now that you've learned the ropes, here are some Inspect Element keyboard shortcuts that'll make using it even easier.
Mac | PC | |
|---|---|---|
Open Inspect Element | command + shift + C | Ctrl + Shift + C |
Toggle Device Mode | command + shift + M | Ctrl + Shift + M |
Search current panel | command + F | Ctrl + F |
Open search tab | command + option + F | Ctrl + Shift + F |
Open/close search tab | esc | Esc |
Zoom in or out | command + or command - | Ctrl + or Ctrl - |
Restore default zoom | command + 0 | Ctrl + 0 |
Move between nodes | Up arrow or down arrow | Up arrow or down arrow |
Expand selected node | Right arrow | Right arrow |
Collapse selected node | Left arrow | Left arrow |
Toggle Edit Attributes mode | return | Enter |
Move to next attribute | tab | Tab |
Hide selected element | H | H |
Increase or decrease a selected property value by 1 | Up arrow or down arrow | Up arrow or down arrow |
Increase or decrease a selected property value by 10 | shift + up arrow or shift + down arrow | Shift + up arrow or Shift + down arrow |
Inspect Element tutorial FAQ
Is Inspect Element legal?
Hopefully it felt so easy that it should be illegal, but yes, Inspect Element is completely legal. Just don't break the law by using Inspect Element for malicious purposes, like attempting to bypass paywalls or alter website data with harmful intent, which could have legal consequences. It all depends on how you use the information you find while using Inspect Element.
Can a website see when you inspect an element?
No, it can't. Everything you do within the safe space of Inspect Element is between you and your browser, so experiment away.
How do I use Inspect Element?
In short, read this article. But, to drive the point home, right-click any webpage element and select Inspect to view and temporarily edit its underlying code (HTML, CSS, JavaScript) directly in your browser. This tool allows you to examine website structure and styling, whether that's for learning or troubleshooting purposes.
Related reading:
This article was originally published in January 2015 by Auri Pope. The most recent update, with contributions from Dylan Reber and Megan Orr, was in April 2025.


