I'm the co-founder of Service Direct, an advertising technology company based in Austin, TX. We offer lead generation solutions for local service businesses, and we like to think we take a lot of the complexity and risk out of online marketing for local small businesses. How? By delivering the one thing they really need: inbound phone calls from purchase-ready customers that need their services.
In order to do that, we've developed a lead generation platform that allows our clients to build, manage, and track their pay-per-lead account with us. Essentially, clients tell us what types of leads they want and where (and how much they'll pay for them), and then our technology goes out and promotes their business online, driving exclusive phone (and form/email) leads directly to them. They can then track everything through our dashboard to understand their ROI and optimize their campaigns.
As you scale your small business marketing, take a look at these 4 ways to use marketing automation to grow your business.
Our problem
We recently launched a new product offering in order to address a different segment of our market and scale growth more efficiently. As part of that product offering, we gave our clients more control over their account setup, essentially allowing them to create their account from scratch without ever speaking to a representative from our company.
While it did allow us to scale more quickly/efficiently, it also resulted in user behavior that was dragging down our average revenue per client. Where normally we would have someone from our team explain best practices for setting up an account, our customers were now free to set up their account however they chose to. As it turned out, without that initial discussion, accounts were being created that didn't have much chance at success.
The good news: because we had a solid foundation in data collection and visibility, we saw it happening. We were able to spot the underlying issues and build both data visualization and automated messaging tools to address these problems and drive better client behavior. The result was a significant increase in our per-client revenue, but just as important, better informed and ultimately happier clients.
If you're collecting complex data, it can be hard to accurately and efficiently keep track of it. Here's how to use automation to track complex data, reducing human error and eliminating repetitive work.
Data discovery: Spotting negative user behavior trends
We've been in business for 15 years, which meant we had a solid bank of data to understand what was going on. With that backdrop, some concerning trends became immediately evident through our data visualization tools (more on that later).
Customers were signing up for our service in locations and service categories where we would not be able to get them leads. Previously, our sales team would have quickly identified these prospects as bad fits and discouraged them from signing up. But with our self-service account creation, they were joining our Marketplace but not seeing success.
Customers were choosing a cost-per-lead that was significantly lower than the average bids required to generate leads through our platform. Previously, our sales team would have explained to them what they needed to bid in order to be competitive. With our self-serve account creation, we gave them a wide range of lead prices and they were often choosing the lowest, which all but guaranteed they wouldn't be competitive in our Marketplace.
With our self-serve account creation, we made it easier for customers to pause their account with us. The result was customers were spending more time paused, eliminating our ability to drive leads to them and bill them for those leads.
We knew our new product would address a market that would spend less each month than our existing customers on our core product, but the above behaviors resulted in a significantly lower average revenue-per-client than we anticipated. It was clear we needed to make changes.
Data enablement: Using data visualization and automation to drive results
We decided to approach the solutions to these problems in two ways:
1. Push our backend data to prospective clients
Our lead generation platform is driven by APIs, allowing us to constantly pull in lead supply data from our publishing partners, including the lead service category type, the ZIP code of the lead, and data regarding the costs for those leads won by our clients. By pushing that data from our database to Google Data Studio, we were able to create a data visualization tool to give these prospects insight into the likelihood they could win leads through our Marketplace.
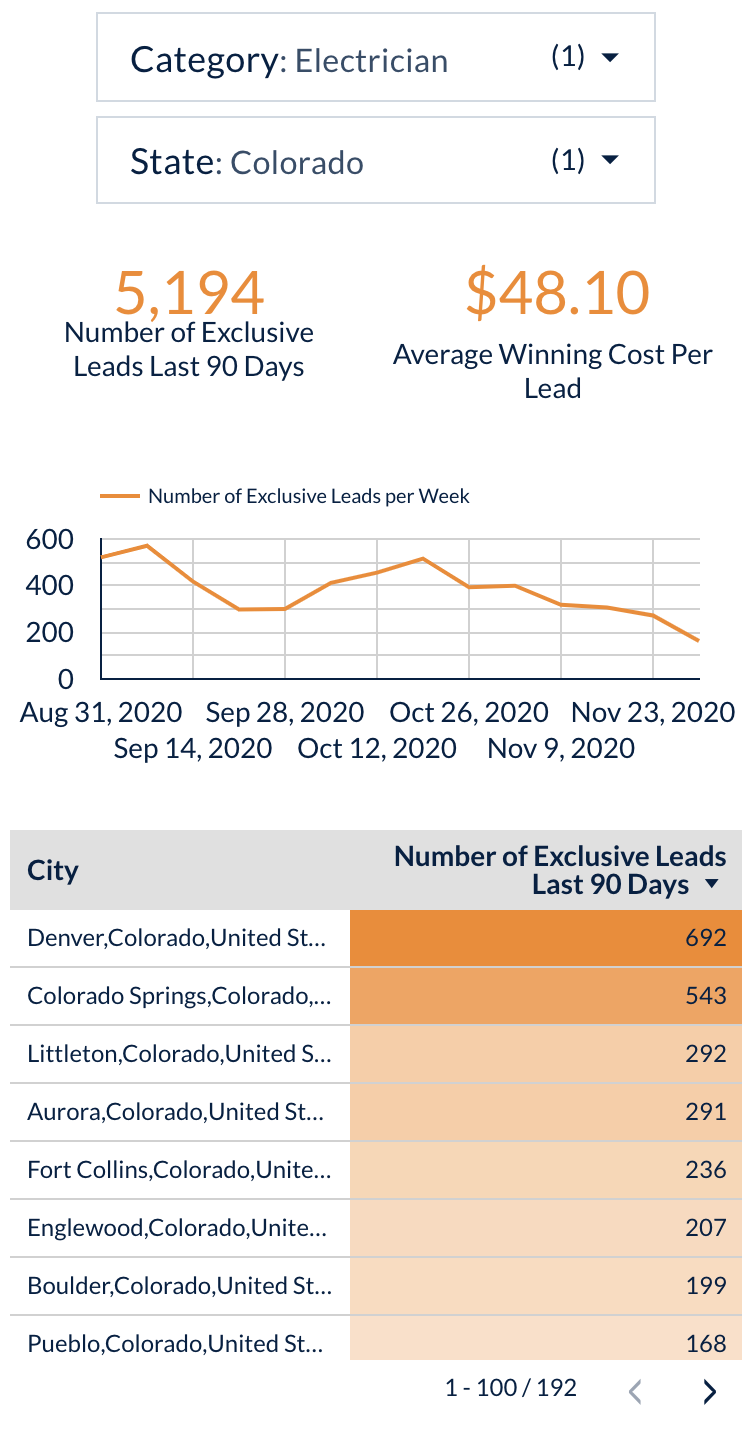
Our belief was that if we could provide potential customers with insight into our lead volume and costs in their area, they would self-select based on whether or not they felt like they could be successful within our Marketplace. Success ultimately boiled down to two keys factors initially:
Are there available leads in their area?
Are they willing to bid competitively for those leads in order to win them?
By giving prospective clients insight into these answers, our hope was that they were able to answer those questions on their own, and then ultimately decide whether or not they would find success within our Marketplace.
2. Use our backend data to tailor messaging to existing clients
Again, there were two distinct client behavior improvements we needed to focus on:
Encourage them to increase their cost-per-lead to win more leads in our Marketplace
Encourage them to remain active in our Marketplace more frequently
We saw an opportunity to push data from our backend database into our CRM in order to automate messaging that was tailored to each client.
In each case above, we took the same approach: we let them know how many leads they weren't getting because they either had too low of a lead cost or their account was paused.
We did so via two methods.
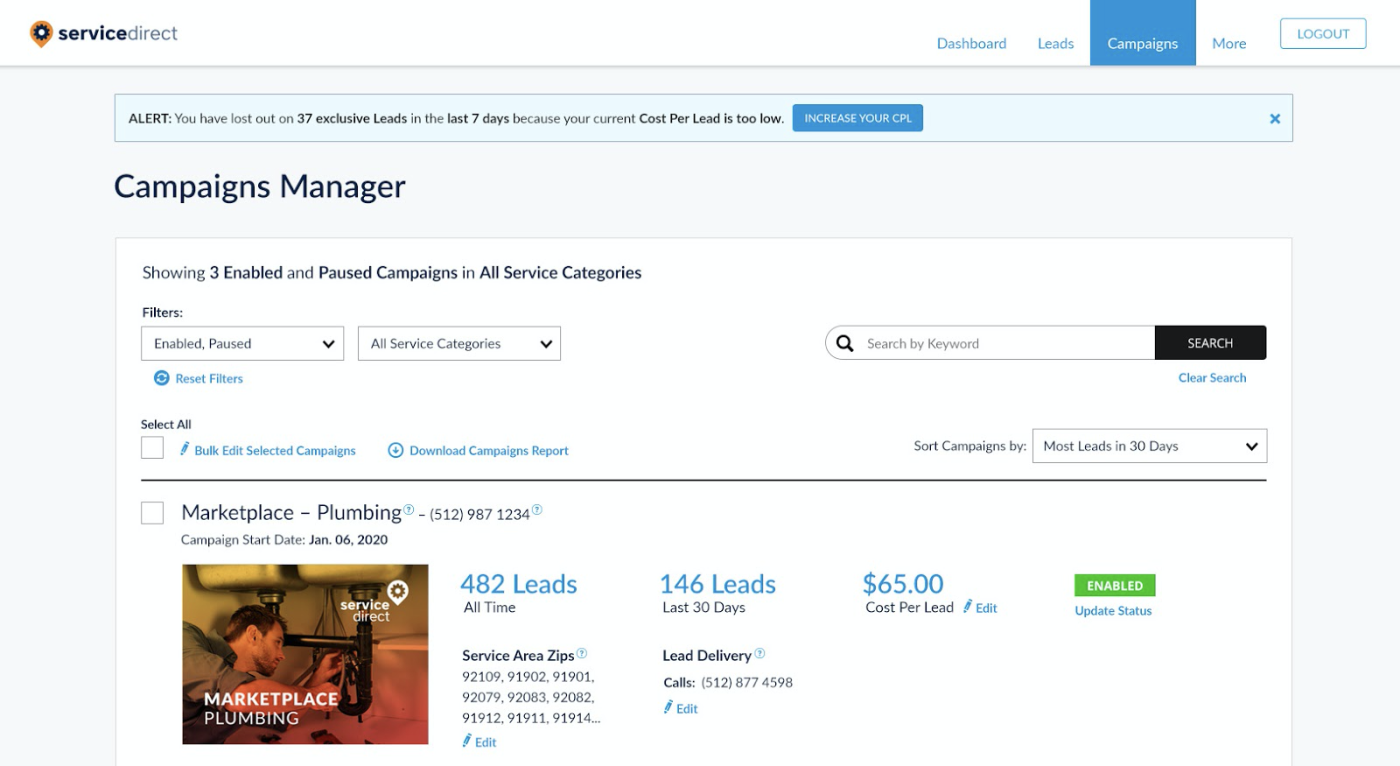
1. Each time a client logged into our dashboard, they received a message notifying them of the number of leads they were outbid on. While many clients were content with their lead volume, many wanted more leads and now understood the number of lost opportunities they had due to being outbid, prompting them to increase their bid.
2. We sent a personalized email to anyone with a paused account, telling them how many leads they'd missed out on. And, of course, a big CTA to reactivate.
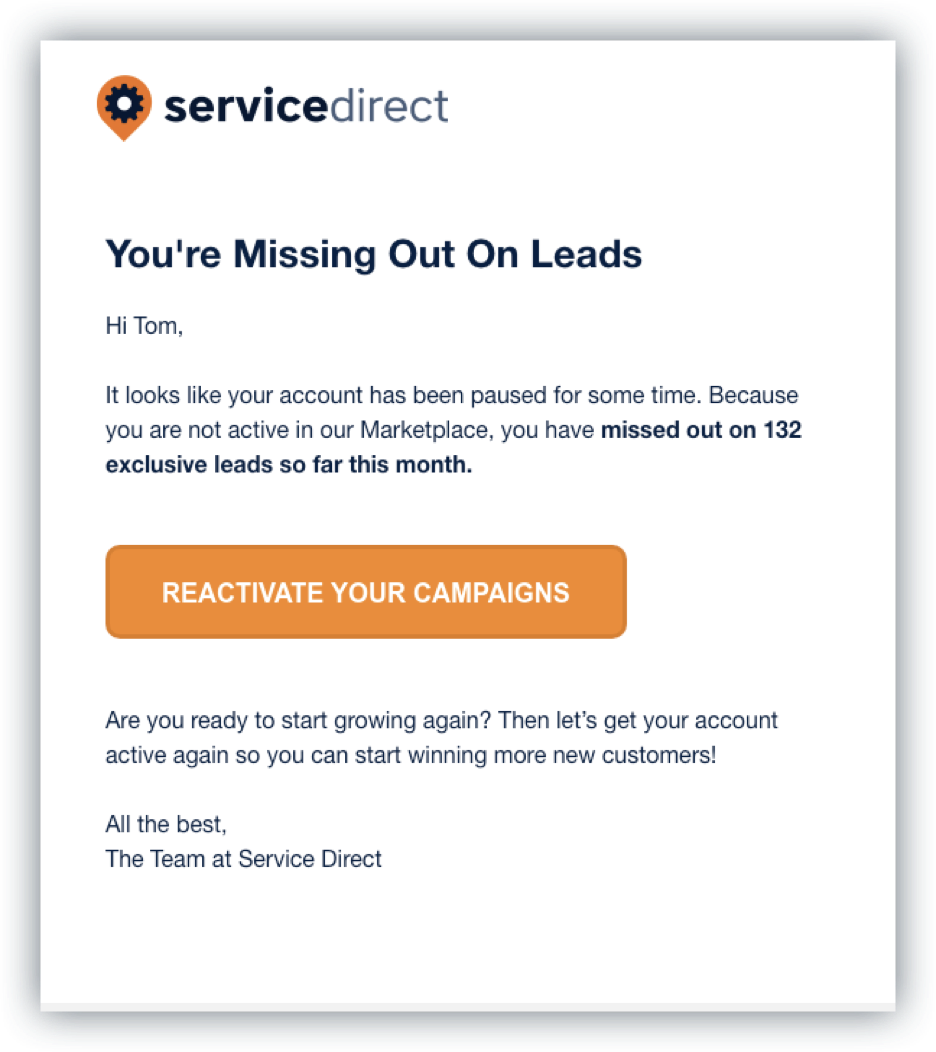
By tailoring our messaging to each individual client, and focusing our messaging around the amount of customers they were missing out on, our hope was that these messages would spur them to increase their bids and remain active in our Marketplace.
The results
So what happened? After six months, the trends were clear. We were able to successfully address our three main problems, seeing noted improvement across these metrics:
23% reduction in account creation
What our data showed was that we saw a 23% reduction in account creation rate. On the surface, that might seem bad. But in reality, those that were dropping out were doing so because they realized we either didn't have leads in their area or they weren't going to win any of those leads because they couldn't stomach the cost.
In other words, the data visualization was working by discouraging those clients that would have been a bad fit from ever signing up.
31% increase in initial price-per-lead
By providing prospective clients with better insight into what average winning bids looked like in their area, they were choosing starting lead prices more in line with what was necessary to win leads.
Before, we'd simply given them a wide price range to choose from, and most chose a cost per lead at the lower end of that range. While that could sometimes result in winning leads, most of the time it would not. Once we gave them insight into a more realistic lead price, we saw an increase of 31% in terms of the average starting cost-per-lead across all of our service categories. We also saw a steady increase in their average cost-per-lead over time.
62% increase in active client rate
The biggest change we saw was that our clients were remaining active in our Marketplace at a much higher rate.
45% increase in monthly revenue per client
The sum result of all of the above metrics was a huge win for us as a company. Through better data analysis/visualization, along with customized marketing automation, we were able to effectively drive up our per-client revenue to the tune of a 45% increase.
Transparency always wins
Transparency is good. More data is good. It gives all parties the information they need to make better decisions. We fundamentally believed this prior to embarking on this project, but what our data showed was that we could provide meaningful information that would allow prospective and existing clients to make better decisions.
With that, here are two final takeaways.
Invest in internal data tools
There are many data visualization tools available these days. We use Google Data Studio and have invested heavily in utilizing it. Sometimes when we build the visualization reports, they clearly show quantitative evidence confirming an assumption we have. But other times, the data either isn't as clear (which requires asking additional data questions), or disproves our underlying assumptions.
Without investing in this data, we would be flying blind. We would be making decisions based on assumptions, assumptions that in some cases would be flat-out wrong. We know this because we lived it for the various stages in our company's early lifecycle and learned some hard lessons because of it.
Unlock data through automation
Your data, in itself, is only so valuable.
For us, the true magic only happened when we unleashed that data to our clients and prospects. We utilize a CRM with API capabilities and have spent resources linking our internal data with both our in-house application as well as our CRM.
Automation doesn't have to be complicated. Zapier believes automation should be easy, because everyone deserves to work smarter—not harder. See how it works.
When utilized correctly, it had a tremendous impact on our company's growth.
This was a guest post from Matt Buchanan, co-founder and Chief Growth Officer at Service Direct, a technology company that offers local lead generation solutions for service businesses. Want to see your work on the Zapier blog? Read our guidelines, and get in touch.
