Data is worthless without analysis. You can collect all the numbers you want; but if you don’t unpack the "how" and "why" behind those facts, you’re left with a list of info that might as well be random.
Content marketing manager Ciaran Lyons uses data to understand the readers of I Will Teach You To Be Rich (or IWT, for short). IWT is the website founded by author Ramit Sethi that helps his readers live "rich" lives—whether that means showing people how to find their dream jobs, start their own businesses, increase their productivity, or get out of debt.
This perspective on living richly appealed to Lyons, who joined IWT's team in 2014 after taking an IWT online course himself. "I was a big fan of Sethi's material and we've worked together ever since," Lyons says.
Upon taking up the content management role, Lyons set out to provide readers with even more content to help them live richly. To do this, he turned to internal data about IWT readers—who they are, what they're interested in, and how they're interacting with existing IWT content. Based on the data, he queues up more content that interests readers.

And yet, this data-driven approach to content management proved elusive on the job. Just creating basic reports on IWT's email subscribers took hours. There was no time left to look at IWT's internal data with a critical eye.
So, he turned to app automation platform Zapier to create an automated data analysis workflow without writing a single line of code.
Here's how the IWT team automatically tracks their customer and subscriber data, so they can spend more time learning from the data—and give their customers and team alike a richer life.
The Challenge: Tracking a Sea of Content and Readers
We were spending more time downloading and massaging data than we were analyzing what that data means.
The IWT team produces a crazy amount of content: books, courses, podcasts, and over a thousand posts on their blog. It's a big undertaking, one that brings in over a million readers every month.
With so much time spent creating content, there's not a lot of time left to track how that content performs and who is reading it. That's why IWT's old process of manually analyzing data frustrated Lyons: it took time that he and his team didn't have.
Each time they needed to answer a basic question like "How many people read the guide that we published in January?", they had to export a report from marketing automation tool , open it in a spreadsheet app, manually run a query in the spreadsheet, then consolidate the results into a readable report.
Whenever there was another question, they'd rinse and repeat the process to answer it. "We were spending so much time manually tinkering with data," Lyons says. "I was like, 'Oh no. This is the most insane process in the world.'"
The answers to those questions would help IWT get to know its readers: who they are, what they do, and what they like. But it took so long to just get the data, there was little time to learn from the answers. "We were spending more time downloading and massaging data than we were analyzing what that data means and how it could help us do our jobs," says Lyons.

There had to be a way to spend less time and energy getting the data—something that would free up time to analyze it.
"We realized we needed a data warehouse for all this information, so that everybody has it at their fingertips," Lyons says. This data warehouse would be a place to store data that everyone could access—one that made it easy and quick to generate reports without technical help. "We didn't want to hire a dedicated data analyst."
It needed to be a self-serve tool, and Lyons knew just how to make it, even though he's not a coder. "I convinced the team to let me create—with a little bit of glue called Zapier—a data warehouse that talks directly to Infusionsoft and that nobody on the team will need to manually touch."
The Solution: Three Zaps and a Database
To build the data warehouse, Lyons needed three things. Open-source database PostgreSQL offered a simple, customizable a place to store and analyze data. The customer info was already in Infusionsoft. And workflow automation tool Zapier lets apps talk to each other via custom connections called Zaps—the glue that would make the data warehouse possible.
Once the data warehouse was running, Lyons and his team wouldn't have to download, upload, and query data to make reports anymore. But first, everything needed connected. For that, Lyons set up three game-changing Zaps to build the data warehouse without roping in the IT team or hiring a data expert.
First, Lyons created a Zap that sent all new IWT readers—the people tagged in Infusionsoft as new contacts—to the PostgreSQL database. Lyons could then search and filter through contacts in the database based on different reader characteristics.
Add new Keap Max Classic contacts as new rows on PostgreSQL
To make this data comprehensible at a glance, Lyons added the Periscope Data extension to PostgreSQL. It turns queries into colorful, easy-to-read charts on the fly to help the team quickly see the number of readers—or anything else—in a second.
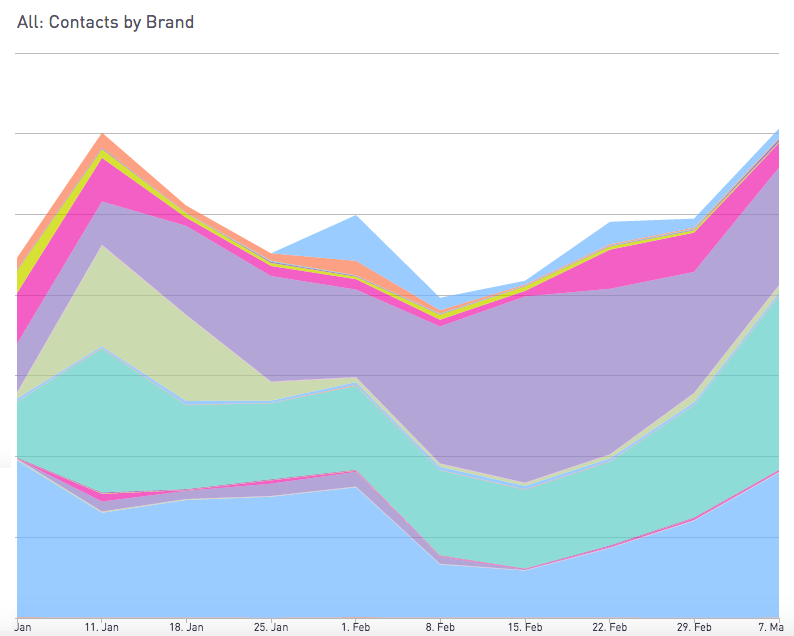
With this data-routing workflow, the IWT team gains insight into the overall health of the business. They can now answer "How many people are reading our content this month?" just by glancing at a chart—something that previously required the painful report-generating-process.
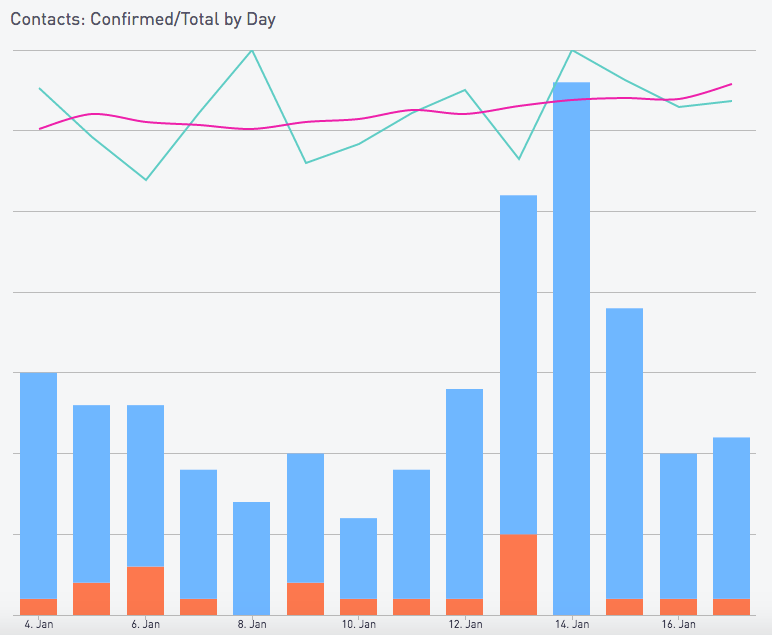
Lyons didn't stop there. To further dig IWT's business health, Lyons wanted to track the rate at which readers confirm their email addresses (also known as a "double opt-in" rate). Whenever anyone signs up for IWT content, they enter their email address and then have to click a link in their email to confirm. This process protects against spam—and makes sure the reader actually wants to hear from IWT.
That's what makes the opt-in rate one of Lyons' favorite metrics: it helps him know how engaged first-time readers are with IWT. So he made a Zap to help track it.

When readers confirm their email addresses, their contact records are automatically tagged as "Confirmed" in Infusionsoft. So, for his next Zap, Lyons had send the information to PostgreSQL whenever an Infusionsoft contact is tagged "Confirmed."
Add new tagged Keap Max Classic contacts to new PostgreSQL rows
Once the new data is sent to PostgreSQL, it powers another Periscope Data graph. The result? Picture perfect insight into how many people want to engage with IWT via email.
Most IWT content is free, but they also offer paid guides, online courses, and books to their tens of thousands of customers. The IWT team tracks payments from each sale using Infusionsoft invoices.
To feed that invoice information into their data warehouse, Lyons set up a similar workflow. A Zap automatically sends new Infusionsoft invoices to PostgreSQL, where Periscope Data turns it into another chart.
Add new Keap Max Classic invoices as rows to a PostgreSQL table
It's then easy to find the total sales, or break down sales by item. They can track, say, the Infusionsoft invoices generated for The Ultimate Guide to Personal Finance guide, and see the total sales with just a glance at a Periscope Data chart.
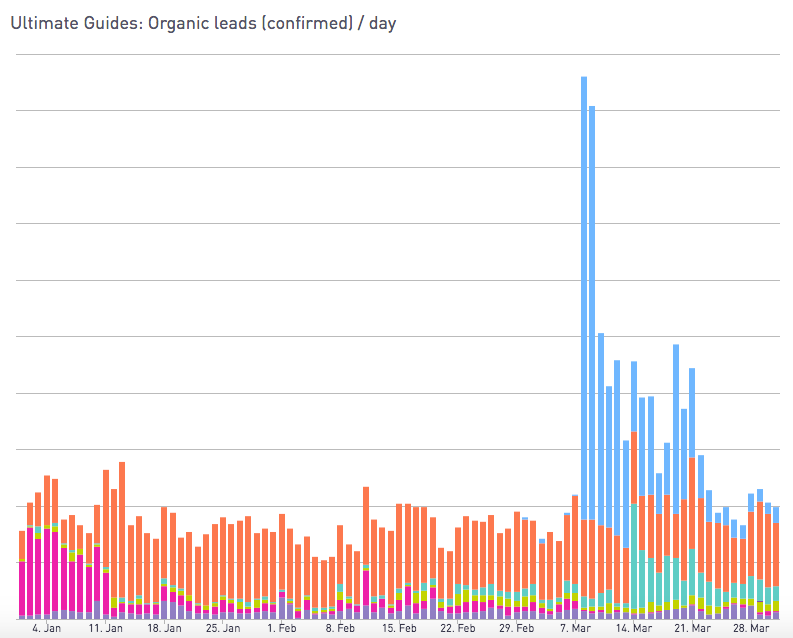
Lyons doesn't have to manually download and query Infusionsoft data anymore: the Zaps take care of that. They can learn from data with automatically generated graphs, in seconds.
The Results: Learning From Data Easily
This has probably saved me hundreds of hours over the past year.
"Now, we can basically report on anything from this," Lyons said. "I never have to log in to the Infusionsoft anymore. Everything is just ready in my data warehouse: it is always fully up-to-date since the Zaps fire every minute. This has probably saved me hundreds of hours over the past year."
The Zapier and PostgreSQL-powered data warehouse did the trick. "When we saw it working, we were like, 'Oh my goodness,'" says Lyons. "Zero lines of code. No involvement from IT or systems administrators."
"That was just a massive win for us—to be able to see all of our contacts in real-time without hours of integration building."
It was time to put that data to use.
Exploring Email Confirmation Rates
Now with the time and tools to answer more questions, Lyons wanted to see what they could learn from their data. It was now easy to answer questions like "How many readers are confirming their email addresses?"
They could even dig in further. Lyons wondered "Why are some readers not confirming their email address?"

The graphs from Periscope quickly pinpointed an interesting answer: readers with Hotmail email accounts were less likely to confirm their email addresses. It wasn't a new phenomena, but was something that would have gone unnoticed before.
"Hotmail users have probably always been confirming their addresses at a lower rate, but until we were able to ask more questions of the data, we just never knew," Lyons says.
Perhaps Hotmail users were less interested in IWT's content—or perhaps they just checked their email less often, and forgot to confirm. So the Lyons and his team decided to make confirming emails easier. They added a dynamic button to the IWT email confirmation page to open your email app—Outlook.com if your email includes @hotmail.com, Gmail.com if it includes @gmail.com, and so on—so readers would quickly find the confirmation email.
"Before that, we had about seven out of 10 people confirming their email addresses," Lyons says. "In the past month, we got it up to eight in 10 people confirming their email addresses. That is a huge win in itself."
The quick answers their data warehouse provided gave IWT a quick win of 10% growth in email confirmation. It wasn't just their content that the data warehouse would help—it was their entire business.
"What this experience revealed to us was having data at your fingertips is a superpower," Lyons says. "When you know you have to do all kind of big exports and imports to ask a question of the data, then you don't ask questions because it is too hard. When you have it at your fingertips you say, 'What will I ask the data today?'"
Discovering Problems Quickly with Dashboards

With more team members joining IWT, there are more people to ask questions, poke at the data, and make improvements. The data warehouse gives the growing IWT team the ability to measure the changes they are making against current and past performance. Now that the data is out in the open for anyone to access, the data warehouse's up-to-date dashboards help them rally around successes and tackle new questions.
"The data warehouse enables the team to always center around core metrics," Lyons says. "You will find me very often just dropping screenshots from Periscope into our team Slack channel just to say, 'Hey look!'"
The IWT team can learn from different experiments, and keep an eye out for warning signs. "Just by watching the dashboards, you can tell if there is a problem right away and escalate it to the right person, rather than waiting for someone to notice it in a routine report," Lyons says. "These dashboards—that sit there watching and waiting—are all powered by Zapier, softly running in the background."
IWT's reliance on these Zapier-powered Periscope dashboards grows right along with their team, helping them create create better content and products, too
"As the team grows, we will be creating products at a faster and faster rate, which is pretty incredible."
And it's all thanks to a simple, Zap-powered database—one you could build, too.
Your Turn
When we saw it working, we were like, 'Oh my goodness.'
Want to learn more from your data—and spend less time searching through it? You can achieve the same results as the IWT team, even if you don't use the same apps.
First, you need a database tool customizable enough to store your customer data. You could use a full-featured database like MySQL or SQL Server, a great option if you already self-host internal business apps. Or if you want something simpler, try , , or other simple database builder apps that help you create databases in a spreadsheet-like interface. You could even build a dashboard for your data entirely with Google Sheets.
Then, make Zapier integrations to add data to your database automatically. You could use these Zaps to send contacts from your form software:
Add new rows to PostgreSQL for new Typeform entries
Add new Wufoo form submissions to a SQL Server database
Create SQL Server rows from new Google Forms responses
Or try sending contacts from spreadsheets or your CRM to database tools:
Add rows to a SQL Server table with new Keap Max Classic contacts
Add new Google Sheets spreadsheet rows to a SQL Server database
To track email confirmation rate like Lyons did, you can send data about unsubscribers or bounced emails from your email marketing platform to your database:
Turn tagged contacts from Infusionsoft into Knack records
Add Mailchimp unsubscribes to a SQL Server database
Add rows to a SQL Server database when new emails bounce from a campaign on ActiveCampaign
Lyons also sent information about paying customers to his custom database by tracking invoices. You can do the same by sending data from your payment processing tool to your database:
Add rows to a MySQL table with new Keap Max Classic invoices
Your team may have data in other software you'd like to use—or you might want to automate other parts of your business. Just check the app directory for thousands of apps that connect to Zapier, then build your own integrations to power your database.
Do you use a custom database powered by Zapier? Let us know in the comments!


