Skip to content

Articles that mention "I Done This"

Showing 1-1 of 1 articles

A pie graph icon

How to automatically pull data for reports, charts, and dashboards

Charts, reports, and dashboards help you identify trends you can use to understand, improve, and develop your performance. Automation can help you get the most of the tools you use to communicate data and make them less labor-intensive to use.

By Wren Noble

•

4 min read

Get AI and automation tips, delivered straight to your inbox

We’ll email you 1-2 times per week—and never share your information.
Your agent builds it. Zapier keeps it running. Build automations across 10,000+ apps.

Sign up
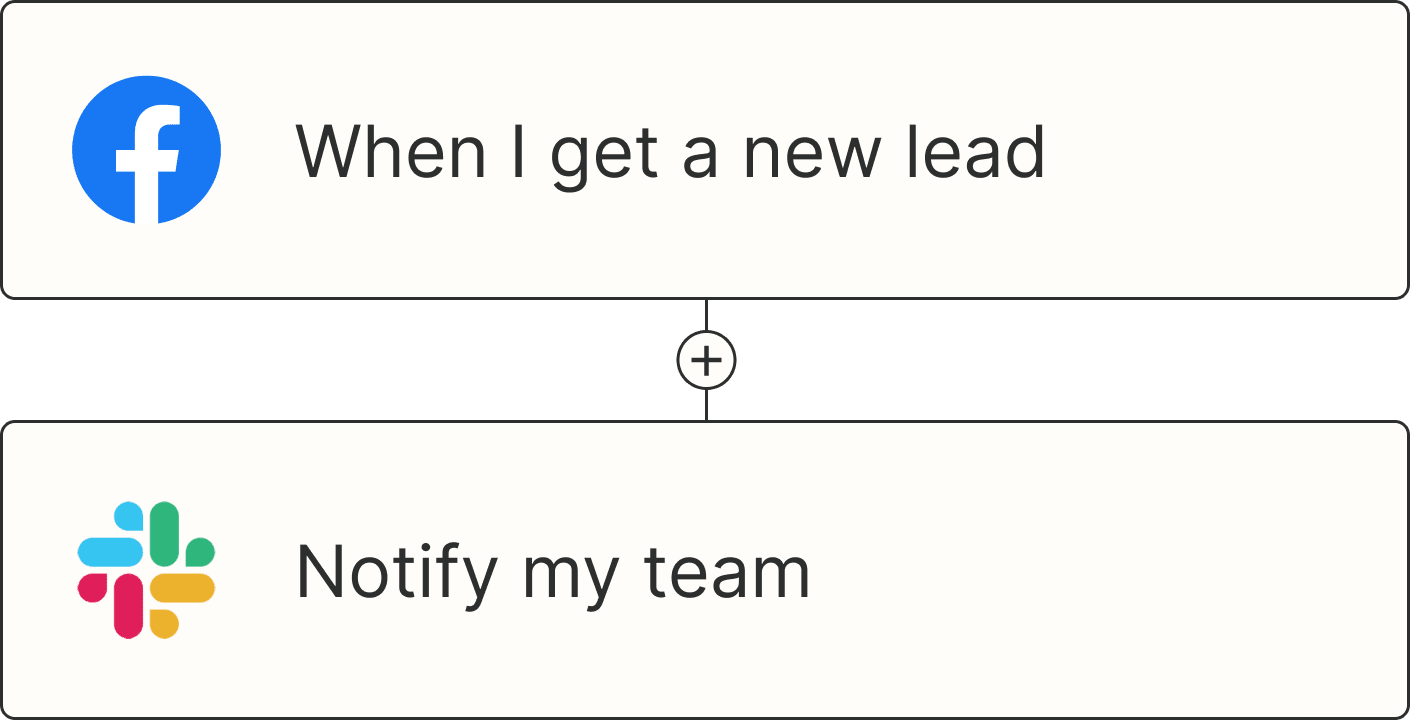
A Zap with the trigger 'When I get a new lead from Facebook,' and the action 'Notify my team in Slack'