Downtime happens, even to the Internet’s largest players. While 100% uptime is the goal, no engineer actually expects it. That’s why we talk about uptime in terms of "the number of nines.” For example, five nines refers to 99.999% uptime, which means a system is inaccessible less than one second per day.
If we’re expecting some level of downtime, that means our beautiful, API-interconnected world needs to account for it. It also means that the more APIs you use, the more likely you’ll bump into downtime that can impact your app’s performance. As the number APIs connecting to the Zapier Developer Platform has grown, we’ve felt the pain of ensuring that inevitable API downtime doesn’t degrade the experience for Zapier users. Here’s what we’ve learned.
What Happens When One API Goes Down?
Many of the 750+ APIs connected to Zapier require polling to check for new data. As often as every five minutes, we spin up a new request to compare updated data against what we found the last time we checked. It’s resource-intensive even when an API is running smoothly. When the API doesn’t respond, the hanging requests could impact the rest of our service.
Here’s an example: Let’s say we have 100 users of the ABC API all wanting to know when new data is available. For simplicity, we’ll assume everyone wants to know every five minutes and we have an optimal polling situation, where every minute we’re checking for one-fifth of the users (20). Even if we only could open one connection at a time, that would allow five seconds per user–plenty of time to get results before the next crop of polls begin.
When an API is down, however, here's what it really looks like:
Minute one: 20 connections, all time out
Minute two: 20 new connections, plus 20 retries, all time out
Minute three: 20 new connections, plus 40 retries, all time out
Minute four: 20 new connections, plus 60 retries, all time out
Minute five: 20 new connections, plus 80 retries, all time out
Minutes six and beyond: 100 retries, all time out until the API comes back up
You can probably start to see how the API downtime snowball effect can take over an entire system if you let it. In our example, the ABC API’s downtime is blocking 100 connections from being used by other API requests our system needs to make. And with over 750 APIs connected to Zapier, this example is hardly hypothetical. We see downtime every day that would have caused similar issues requiring manual intervention in the past.
So, how do we solve these issues with API downtime? By no longer calling APIs that are experiencing downtime. But first you have to know which APIs are down.
Zapier's Simple Load Shedder
Data Scientist Christopher Peters, who goes by Statwonk, set out to make API downtime less painful in late 2015. He wanted to identify which APIs to stop calling before the timeouts piled up to the level that they impacted the rest of our system. To shed the load of poorly behaved requests, we needed to frequently check on response times from every API we poll.

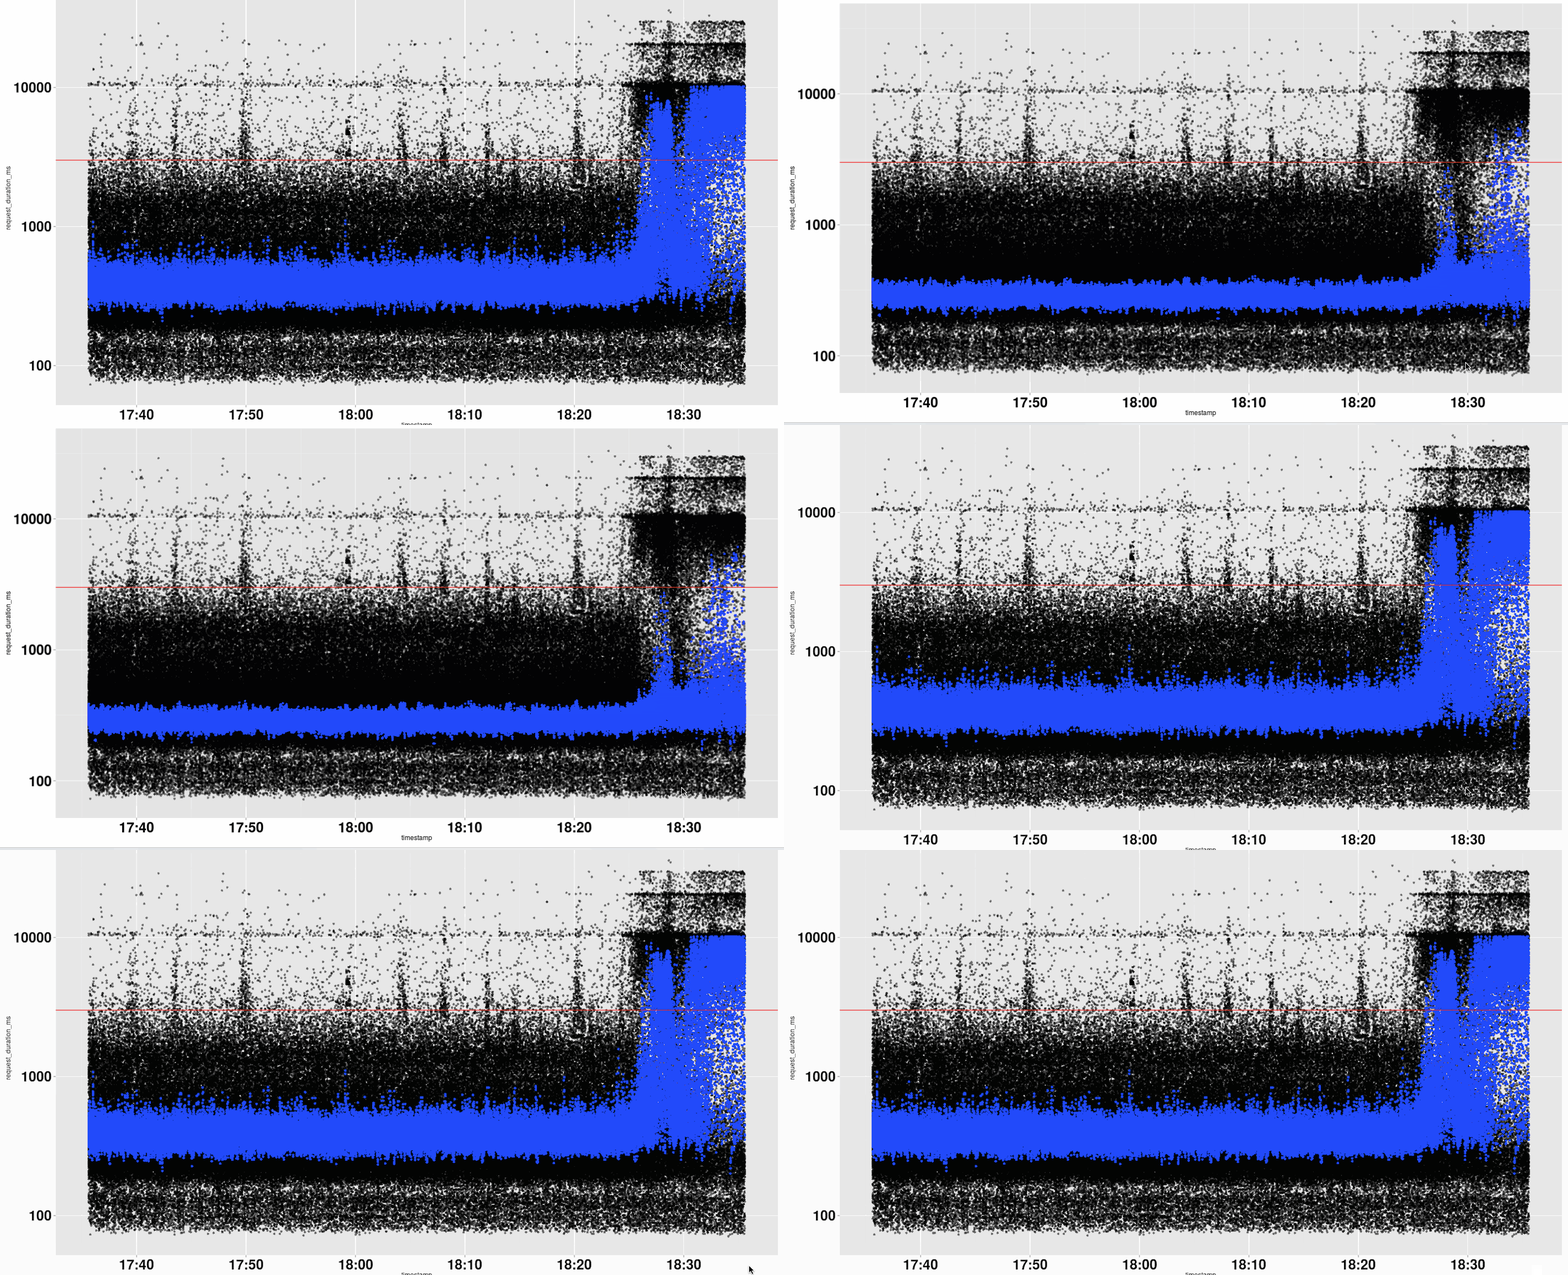
By charting the request durations of several APIs, like the one above, patterns became apparent. When operational, most requests completed in a second or two, though a very few would take a long time. This flips when an API goes down. During downtime or slowdowns–the kind that could impact other areas of our service–we’d see a much greater number have an increased duration.
The animation in the chart compares the 30th and 40th percentile as a rule over a 120-request moving window, with the blue dots representing the appropriate group. An alert is triggered when the blue dots cross the red threshold line set at 3 seconds. A single black dot plotted high on the chart is not predictive of downtime. It could just be an outlier. By mapping requests to percentile-space, we can produce a wider, more discriminant threshold window. As we gained experience with the rule in production, we were able to get alerts even faster by changing the threshold to the 120-request moving window of 10th percentile of response time.
Our original load shedder had a simple, yet highly effective, algorithm. Every minute, for each API that we poll, do the following:
Find the most recent polling attempts
Sort by the request duration
Find a representative of the 10th percentile
If longer than three seconds, we report an incident in a Slack room
From there, an engineer can assess and monitor the situation. After a month or so, the engineers asked for load shedding to be automatic. That is, every time the incident is reported in the Slack room, we also stop trying to poll the API. We’ve found that saves us 5-8 engineer interactions per day.
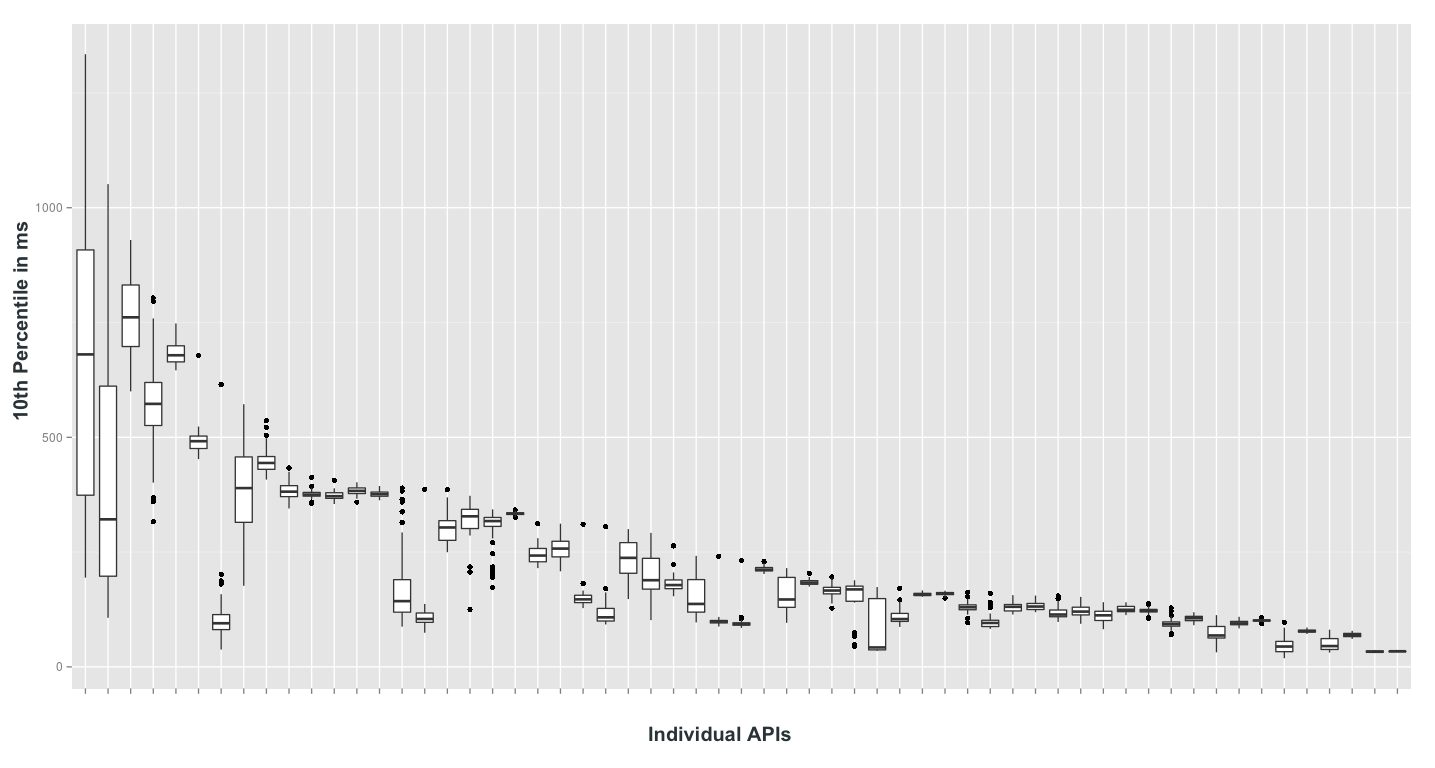
To be confident in the data, Statwonk used boxplots to determine how often the rule would send an alert given a number of week-long samples. After looking at many of these plots, it became clear that mapping response times to percentiles greatly opened the window for an effective threshold.

The beauty of this simple load shedder is that its decision is the same for every API, with no need to store or reference historical data.
It required very little engineering time to save many hours of engineering time. A cron job called a script Statwonk wrote in R (a popular programming language for data scientists) every minute for about six months. Despite the simple setup, the tool worked great. Then the engineering team decided to codify it into the Zapier platform.
The Birth of Prometheus
With Statwonk’s solid foundation, Senior Product Engineer Rob Golding looked to incorporate the alerting system into a larger reliability measurement project. Among those projects was the Prometheus platform, which checks response times and flips the shedding switch if the algorithm’s threshold is breached.
From a technical standpoint, Prometheus is a Django app using a celery queue and redis to process the checking of request times. The app uses the numpy.percentile function to calculate the 120-request length moving window of percentiles. The kairos library creates a time series database to hold the most recent 120 requests for each app and an aggregated long-term history.
Rather than pull recent requests every minute, we send request data to Prometheus as it occurs. Like the cron job before it, Prometheus auto-sheds attempts to call an API that is down. It also automatically creates an incident, which is posted to Slack and added to our support team dashboard, so we can be aware of how the issue might be impacting customers. There is also a private API that Zapier engineers can use to tap into Prometheus data when needed.

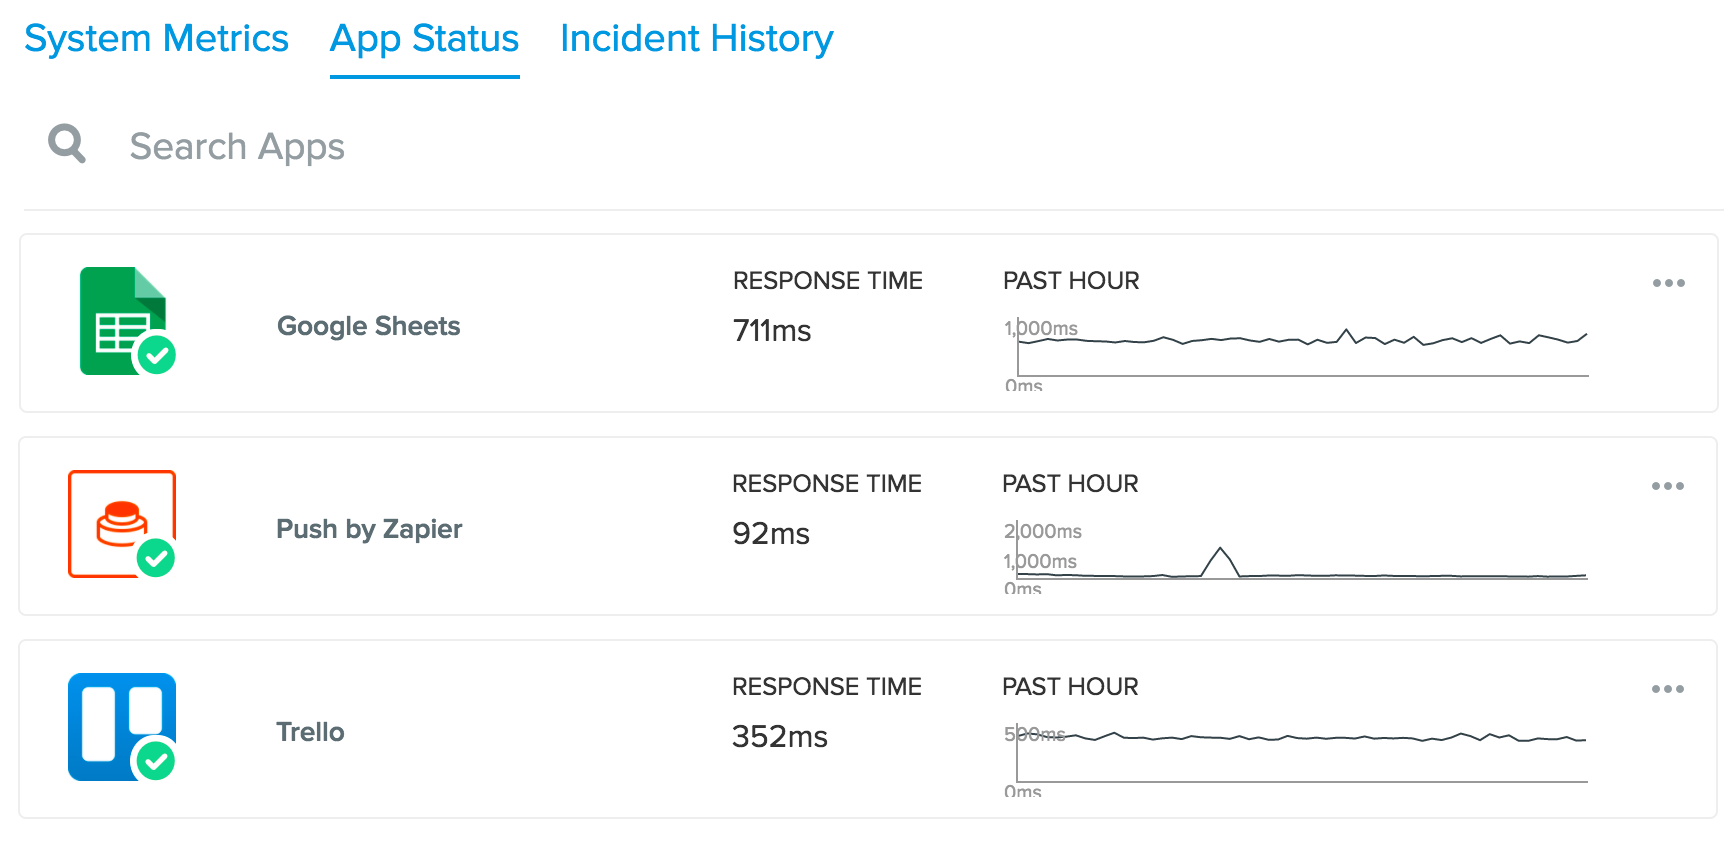
Finally, Prometheus made possible a revamp of our public status page. We share Zapier internal system health, as well as what we’ve monitored for all 750+ apps we support. The same incidents that alert our team also are added to this page, so customers can be aware of issues with the apps they use.
Try Under-Engineering First
You might be surprised to see how simple our solution was to implement. Statistics time and engineering time are strongly inversely related. That is, statistical effort spent determining what’s predictive can save engineering time.
Most alerting systems require large amounts of reference state to find anomalies. If a problem allows for it, we like the idea of mapping data to partition expected and unexpected behavior. Algorithms that can achieve clean separation can enhance simple thresholds and use existing systems to manage response. Taking this route made our alerting system easier to build in the first place and much easier to maintain.
Depending on your problem, it’s possible that using a threshold won’t work in your situation. Automated systems that can afford relatively high false positive to false negative ratios are good candidates for this approach. In our case, we’re shedding the load for a short period of time before retrying to see if the API is still down. In the unlikely event that we have a false positive, we’ll fix it automatically within a few minutes when we make another call to the API experiencing downtime.
Obviously, not everyone is making calls to 750+ APIs every few minutes. Yet, as APIs become more within the critical path of applications, you’ll want to have a way to handle the API downtime snowball effect.
You can also join the growing list of APIs that Prometheus watches by connecting your app to the Zapier Developer Platform.


