New for Basecamp: Track Project Progress With Hill Charts

It's difficult to see the full picture and estimate how close your projects are to completion when your team's to-do list is full of unfinished tasks. Gantt charts and kanban boards can help, but the former requires detailed scheduling, and the latter can still feel ambiguous.
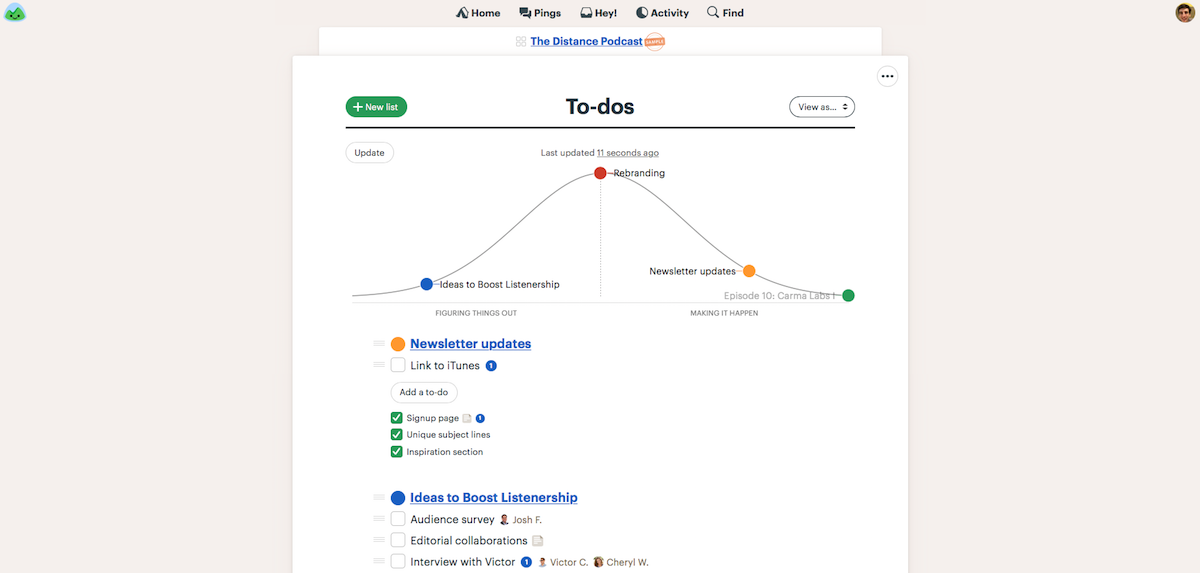
The Basecamp team had another idea: Hill Charts. They're a unique way to visually estimate how far along various parts of your project are. Basecamp already lets you organize projects into separate to-do lists, and it's those individual lists you'll track on the Hill Chart. Select a list, choose Track this on the Hill Chart from its menu, then drag the dot to the spot that feels correct for that project.
Say you have a list with only a couple tasks, but you know each of those are challenging tasks that your team hasn't quite worked out how to complete yet. That list might not entirely be over the hill's hump yet—so you'd leave it on the left side. Or maybe another section in your project has many easy tasks, your team knows what to do, and the end's in sight. That list might be better on the lower right of the graph.
Hill Charts aren't metric driven, with the position based on how many tasks you've completed. Instead, they're a way you can set how you feel about that part of the project, and how much work it'll take to finish. And since they work from your existing task lists, they don't require changing how your team uses Basecamp.
If you're already using Basecamp 3, try adding your task lists to a new Hill Chart. It just might be the tool your team needs to track project progress.