How do you define a productive day? How does your coworker define one? How about your mom?
There’s no right answer. All of us have different goals, different work styles, different priorities. The only constant factor is this: We want to do more important work, with better results, in less time.
There are a lot of different factors that affect your productivity, from mood to environment to health to distractions. To be more productive, you first have to understand the conditions and elements that contribute to your best days—and your worst.
The Quantified Self (also known as lifelogging) movement advocates knowing yourself better through self-tracking with technology. The idea is that, the more you know about yourself—your inputs (ie, food consumed), states (ie, mood), and mental or physical performance—the more you will be able to improve your inputs and affect your behaviors in ways you desire.
The theory is solid, and has led to the popularity of tracking apps. There's one catch: Having the right data won’t change your life. You have to interact with and apply it in meaningful ways.
These three steps will help you do just that.
Step 1: Gather Data
First, ask yourself: What are you trying to improve? Make the answer as specific as possible. "Get healthier" is not as powerful a goal as "eat 8 servings of vegetables every day" or "do 30 minutes of cardio daily." Don’t be afraid to break an aspiration down into small, SMART—Specific, Measurable, Achievable, Realistic, Time-bound—goals.
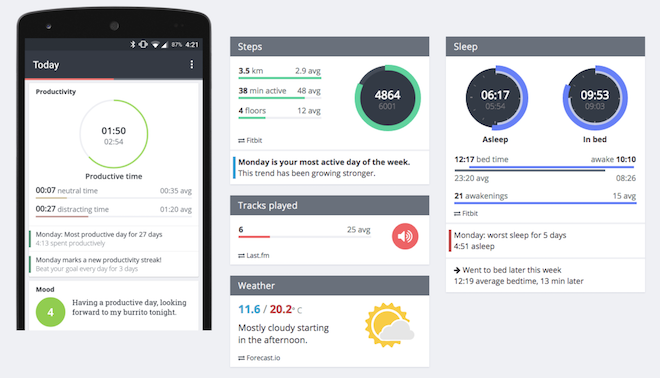
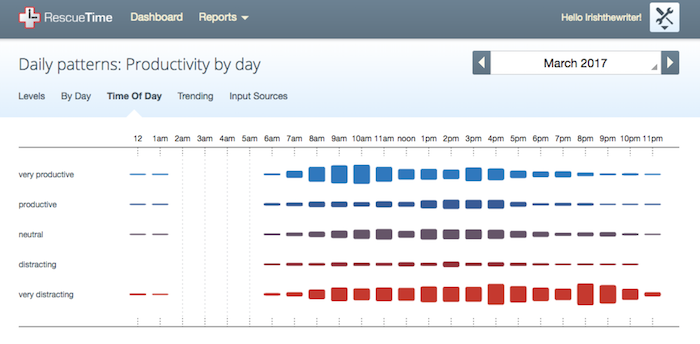
Once you have a specific goal, you can determine what data to track. There are a lot of excellent tools that can help gather this data—everything from devices like smart watches and Fitbit to software like RescueTime.
Related Reading:
The key is to look beyond the numbers themselves, and look at the trends and patterns they reveal over time. While you can chart this data in a chart or spreadsheet, an easier option is to use a dashboard app like Exist, Gyroscope, or Instant. These tools gather data from multiple sources—including your smartphone, Fitbit, or online accounts—and process them into usable reports.

Once you’ve decided on the apps you’ll use and have started collecting data, you’ll want to wait somewhere between a week and a month before you move on to Step 2. This gives the apps enough time to collect enough data to accurately reflect your daily life.
When you have this snapshot of your activities and metrics across weeks and months, you’re ready to really dive into the data and start looking for trends.
Step 2: Don’t Make the Data Too Easy
If you’ve ever tried to track personal metrics, I’m sure this statement won’t surprise you: it’s not enough to have access to the data. It’s easy to think that tracking calories, exercise, or productivity at work will automatically lead to changes in behavior, but that almost never happens.
The reason for this, some psychologists now say, is that the data is just too easy to absorb. Recent psychological literature shows that when information is easy to consume, it’s actually far less effective.
In his Psychology Today article Online Behavior and Disfluency: The Ugliness Payoff, psychologist Diogo Gonçalves describes it this way:
When it comes to learning and memory, making things easier is not always ideal, because fluency makes people less likely to comprehend and remember what they read. Thus, contrary to the idea that the easier the better, making material harder to read—what researchers in cognition called disfluency—might actually improve comprehension.
This principle is contrary to the design theory that governs most popular apps, which says the interfaces and interactions should be as easy to use as possible. This means that, as a rule, the apps you use to gather your data will make the data simple and easy to process.
But if you really want this data to make a difference in your life, you’ll have to dig past the visually pleasing reports and dashboards.
Author Charles Duhigg, in a segment with 538’s "What’s the Point" podcast, explains why.
Often, paradoxically, to make data work for you, you have to slow it down and make it harder to absorb. […] In order to learn something, you actually have to play with it, and to play with it, you have to use it in a way that is not simple at first.
Duhigg goes on to use the example of a bathroom scale that automatically sends your weight to your iPhone and creates beautiful charts with it:
It’s so easy to see how your weight has changed over the last two weeks. But it turns out that the correlation between that and actually losing weight is almost non existent. That’s because it’s so easy to look at that chart, that you look at it, and then you just look at something else.
A researcher colleague of Duhigg's experimented with this problem, and found a solution when he asked his study group to recreate these weight charts by hand every Sunday night. Seems almost stupidly simple, right? But the results spoke for themselves:
This caused a bigger behavioral change, because when people are drawing that chart, they think to themselves "Oh, my weight went up on Wednesday, and I remember on Wednesday I woke up late and I got something disgusting to eat and I was rushing to work and I didn’t get a chance to work out."
You start seeing these connections. But you only see those connections if you interact with the data. So in many ways the question isn’t just can you collect the data, but can you collect the data and then force yourself to do something with it that turns it into actual knowledge.
Find a way to interact with your data that works with your schedule and personality; just make sure it’s not too easy. Here are a few ideas to get you started.
Chart the Data by Hand. Using the research of the study group mentioned by Duhigg, even doing something as simple as copying your app data by hand will make you interact more with the data, which leads to more of the behavioral changes you want.
Look for Outliers. When you look at your data, keep an eye out for days or metrics that stand out from the rest, or were very different from what you expected. Take the time to look for patterns among these outliers. Figure out why they occurred, and what you can do about them (either to recreate them or eliminate them).
Identify the Variables. Your data will be constantly shifting. It’s your job to figure out why it shifts the way it does. Go beyond just noticing weekly or monthly patterns—dig in, and look for the "why" behind the patterns.
Take Notes. By journaling, or even just jotting down some notes on a daily basis, you are consciously giving your attention to the qualitative variables in your day.
Once you start to understand your data, you’re ready to move onto the last step: experimentation.
Step 3: Experiment with the Data
When we encounter new information and want to learn from it, we should force ourselves to do something with the data.
Charles Duhigg
So now you’ve gathered data and you’ve studied the data, but you’re still only two-thirds of the way there. After all, what good is knowing if it doesn’t translate to doing?
In his book Smarter, Faster, Better, Charles Duhigg summarizes his findings when studying people who used data effectively. The key, he says, is:
The people who are most successful at learning […] are the ones who know how to use disfluency to their advantage. They transform what life throws at them, rather than just taking it as it comes. They know the best lessons are those that force us to do something and to manipulate information. They take data and transform it into experiments whenever they can.
This is the key to using personal data to make changes in your life. It’s not enough to know your health or productivity trends and then try to "do better." Once you have gathered and studied your data, it’s time to run some experiments.
Experimenting with your life forces you to engage more fully with your daily experience. It forces you to pay attention to the little details that have a big impact on your life.

For example, if you’re tracking your sleep via an armband or app, don’t just accept the data—play with it. How does the data (your sleep quantity and quality) change if you turn off all screens an hour before bedtime? How does it change if you use a new pillow, or adjust your sleep schedule?
Or if you’re trying to reduce time spent on Facebook, don’t just use your RescueTime reports as shock and awe. Run experiments. How does your usage change if you move your phone away from your nightstand? How does it change if you turn off notifications, or if you delete the Facebook app? (For example, I found that deleting my Facebook app and not checking Facebook until after 11:30am led to a significant decrease in how much time and attention I gave the app later in the day.)
The variables may seem small, but they are the knobs and levers that you must use to adjust yourself to peak productivity. It will take several experiments, and you’ll hit a lot of dead ends, but if you refuse to become passive about your self-data, you will continue to find new ways to improve your productivity.
Now you know how to start changing your life through self-knowledge, but the "how" won't matter unless you attach it to a "why"—the reason you want to change—as well as "when" and "where" you'll get started. So pick one problem you’re facing and walk through these steps. Tweak them, customize them for your life and personality. But above all, never stop learning and experimenting.
Related Reading:
Chart image by William Iven.


