Can you recall your latest search for a new restaurant and how you decided on it? If you're like me, glued to your smartphone and running a dozen applications simultaneously, the decision might start from eyeing a restaurant on the street or hearing about it from a friend, looking it up on a review site, checking it out on Google Maps, and visiting the restaurant's Instagram feed to look at their food photos--all before finally deciding to rally a few people to test it out for ourselves.
And if we like it? We’ll busy ourselves by going back to these review sites, Instagram, Facebook, and so on to upload our own content. It goes full circle. This is how we make decisions now: The journey consists of many tiny, fractured moments--micro-moments--that seem completely disconnected from each other until the whole journey is complete. For marketers and product owners, this means that winning over users is now a race measured by the moment.
A thriving product needs to adapt to the millions of ways a user wants to interact with it before it can motivate the user to perform a desired action. That’s what I call "adapting to persuade." By tapping into persuasion science and designing for your users' micro-moments, you will greatly improve your users' experience with your product. Here's how Facebook, Netflix, and Visme design for micro-interactions and better engage and persuade users.
What Are Micro-Moments and Why Do They Matter? How Persuasive Technology Can Drive Mass Adoption How to Design for Adaptive Persuasion
What Are Micro-Moments and Why Do They Matter?
Google defines micro-moments as "an intent-rich moment when a person turns to a device to act on a need - to know, go, do or buy." This is especially true for mobile marketing where the brand needs to be there 24/7 to be found by potential customers by search, advertising, and social media.
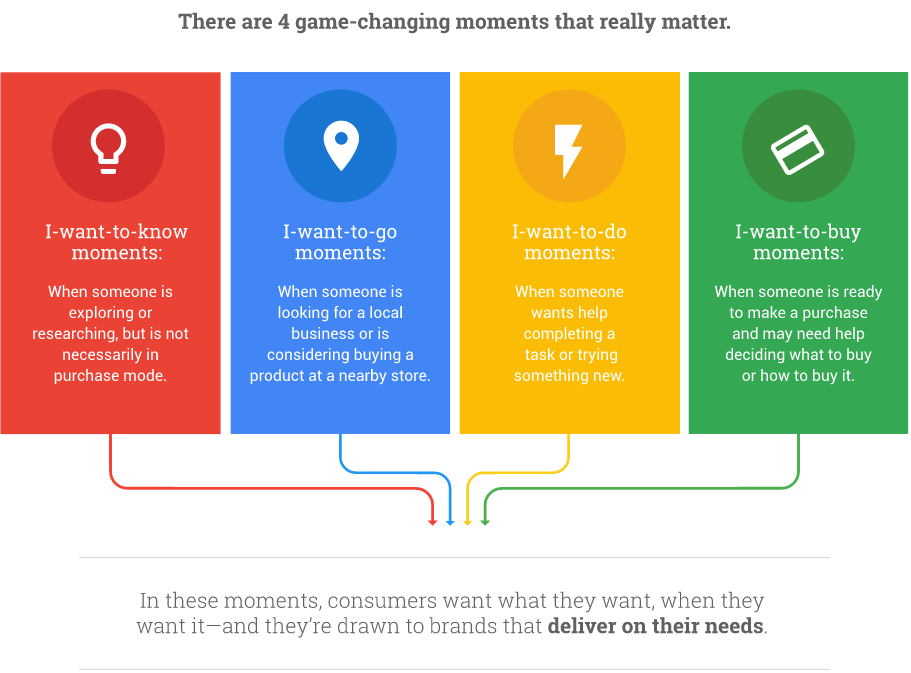
Beyond marketing, micro-moments become richer and more interlocked the more a user interacts with an app--a chain of reaction that builds up momentum if the user is motivated. For user experience design (UX), micro-moments or micro-interactions are characterized by brief touchpoints a user has with the product interface to perform minuscule tasks--whether it’s scrolling to refresh the newsfeed, tapping to sync data, opening an app to view a notification, or clicking to like an update.
Micro-interactions are so unnoticeable that they are often taken for granted. When viewed individually, these moments are so small-scaled that they seem to carry little weight in the entire user journey. But it is these tiny interactions that add up to the entire user experience.
Seamlessly designed micro-interactions can weave into a smooth user journey that meets and exceeds user expectations. Whether your users love or hate your product depends on these micro-moments--you win over hearts when every single interaction, no matter how small, delights your users.
According to Dan Saffer, author of the book Microinteractions, there are four parts to designing micro-interactions. A micro-interaction doesn’t end when the moment is over; rather, it feeds back into a "habit loop" that is designed into the journey.
Trigger: Initiates an action
Rules: What happens in the interaction
Feedback: How you know what’s happening
Loops and Modes: What happens next

Now you’ve come to realize the importance of micro-interactions, what’s more important to know is that micro-moments can be designed to persuade user behavior. What happens if your user finds notifications annoying? They will go into the app's settings and mute the notifications permanently. That would be a terrible change for you! To know what "triggers" effectively motivate your user to take the action you desire them to take, you need to dig deeper into persuasion science.
Use Persuasive Technology for Mass Adoption
How many times do you launch Facebook when you want to share your life updates with people you care about, be inspired by interesting news stories, or be entertained by people's stories? When you scroll through the newsfeed, do you feel a cascade of emotions that vacillate between elation and frustration? Are you then compelled to comment, like, or share? That’s technology as persuasion in action.
Persuasive technology was first introduced by BJ Fogg, founder of Stanford Persuasive Technology Lab and part of the team that worked on Facebook’s early user persuasion programs. In a nutshell, persuasive technology is often designed with the intention to change a user’s attitude of behavior. The process is easily scalable through automated systems that adapt to changing user behavior in real time.
From working on Facebook’s early user acquisition programs, BJ Fogg came up with a ‘Mass Interpersonal Persuasion" (MIP) framework. A key ingredient in Fogg’s MIP framework is that it provide users with a "persuasive experience", where the end goal of a persuasive technology is to change attitudes or behavior.
So, simply entertaining or informing users is not enough; the design intent is to compel change. In the case of Facebook, behavioral change primarily driven by social influences such as compliance, ingratiation, group dynamics, and so on. Here, putting psychological insights of human behavior to work is key.
How to Design for Adaptive Persuasion
Apart from encouraging mass adoption, persuasive technology’s true power lies in micro-level engagement. Designing your product for adaptive persuasion boils down to 2 things:
Gather the right user data at micro-moments throughout the user's lifecycle
Use metrics to guide decisions and design a system that adapts to micro-interactions
This is what data-driven UX is about: Let the hard numbers speak, not aesthetic judgments or design sensibilities. Gather the right data, and optimize for the important metrics.
Gather Micro-Level Interaction Data
Jack Welsh, the former CEO of General Electric, famously said there are only two competitive advantages. Number one is to "learn more about your customers faster than the competition." Number two being "turn what you learn about customers into action faster than the competition." Considering that there will be 45 zettabytes (40 trillion gigabytes) of data for every person on earth by 2020, the ability to turn this raw data into actionable insights will be the ultimate competitive advantage.
Facebook is an early example of leveraging user data to engineer persuasive experiences. The data science team at Facebook collects and analyzes a myriad of behavioral data like an academic puzzle, identifying patterns of human behavior, drawing correlations between actions, and predicting what people want and don’t want.
For example, the data science team published this research on what motivates newcomers to Facebook to contribute. After studying the effectiveness of several mechanisms to encourage contribution such as social learning and feedback, the team was able to make data-backed design recommendations for a more newcomer-friendly platform.
In another example, Facebook has studied the most played songs on Valentine’s Day and compared the songs people listened to when entering a relationship vs after ending a relationship. This kind of user knowledge can potentially help Facebook serve out the right content that matches people’s relationship status: if a user is recently single, he/she might be turned off by "Just the way you are" by Bruno Mars.
Cameron Marlow, former head of data science at Facebook says:
Our goal is not to change the pattern of communication in society. Our goal is to understand it so we can adapt our platform to give people the experience that they want.
The viral app of over 1 billion daily active users is able to collect micro-level behavioral data on all of your opted-in likes and shares, everyone you follow, and every group you belong to. Its automated system--a smart algorithm--then interprets user preferences and pushes out newsfeed content catered to this specific user’s behavior.
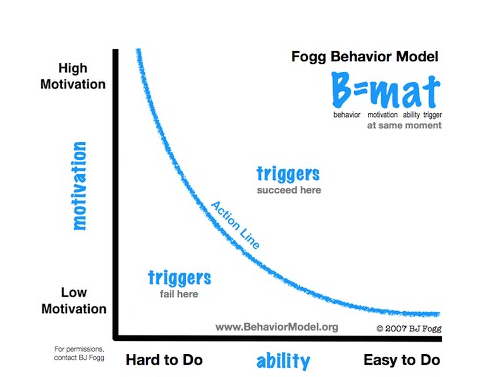
BJ Fogg presented a somewhat simplified model of how the Facebook algorithm works: by putting HOT triggers in the path of motivated people. He argues that 3 elements must converge for a desired behavior to occur: Motivation, Ability, and Trigger. Because Facebook understands user motivation through micro-level data, it’s able to serve out contents users want to see (trigger), and make it easy for them to act (like, share, comment).
Another example of harnessing micro-interaction data for better user experience is Netflix. Netflix is a known leader in offering customized recommendations based on the user’s "taste profile"--a feature that makes mass personalization possible based on individual preference. Boris Evers, Director of Global Communications at Netflix, once said: "there are 33 million different versions of Netflix."
These personalized recommendations are based on highly granular user data such as completion rate, content watched during the weekday versus the weekend, when users pause and leave content, rating, browsing, scrolling behavior, and more. Their goal for the recommendation algorithm, as outlined in Netflix’s tech blog, is to "help members find content to watch and enjoy to maximize member satisfaction and retention."
Here is the daunting task Netflix faces: they have 60 to 90 seconds to persuade a user to watch something from its 13,000 titles before user loses interest--one of the reasons all of Netflix’s 85 million+ users across 190 countries have different recommendations. For a product where about 75% of user activity is driven by recommendation, serving the right content to each user is key. Netflix has several algorithms running at the same time crunching user behavior, browsing, and search data in real time, optimizing for different purposes.
User data can also lead product development. When deciding what content to roll out, Netflix looked to its user data. illustrated by Mindshare Chief Digital and Strategy Office Norm Johnston explains how Netflix mapped user viewing data and found out that those who enjoy Kevin Spacey also enjoy David Finch. So Netflix decided on a big move to adapt to this user preference by rolling out a Netflix original series starring Kevin Spacey directed by David Finch--House of Cards. Needless to say, it was a huge commercial success.
What Does This Mean for SaaS?
While tech giants like Facebook and Netflix may benefit from having a robust data science team for crunching user data, lean Software-As-a-Service (SaaS) teams aren’t necessarily left out of the big data game. Technology has made it possible for any SaaS product owner to engage millions of users. We have more tools and resources than we realize in order to collect, analyze, and act on these micro-moments.
There are two types of user data SaaS products can collect from its user base: qualitative (such as demographic data, user self-reported attitude data, mass survey data) and quantitative (micro-level behavioral data such as user sign ups, app logins, session lengths, drop offs, frequency of usage, and recency of login). Both data types are immensely valuable to us but serve different purposes. Qualitative data help us segment user needs on a macro level, while combining these macro user insights with micro behavioral data can help us determine the right path towards persuasion.
Speaking from our experiments at Visme, a web presentation and infographic app for non-designers, we have done two things to tap into the macro-intent and micro-moments of target consumers: ethnographic studies through user interviews and surveys to fully understand what our users need to accomplish. Based on this understanding, we made micro user interface improvements that speak to their needs at every touchpoint with the product.
For instance, user surveys help us understand who our users are on a broader scale--their industries & job roles, design proficiency, functional needs, and pains--with a large sample size. We were able to find very useful insights such as the fact that less than 25% of all users reported to be "very proficient in design." Meanwhile, over 77% of them said that they wanted to learn more about data storytelling and visual communication, but very few actually read related blogs on a daily basis.
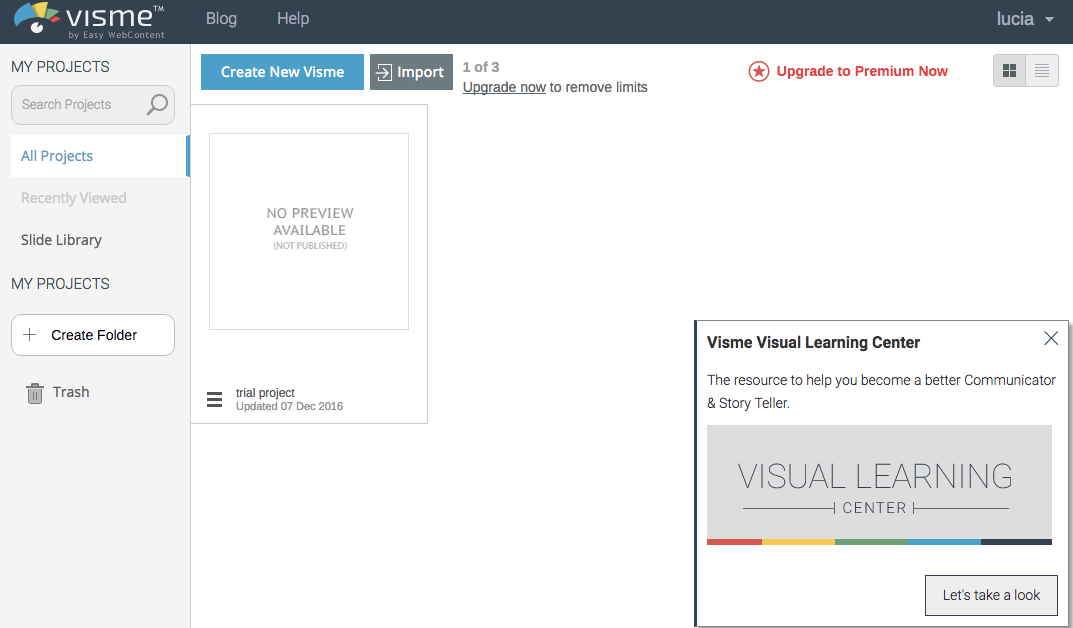
Reflecting on this data, we realized a few things: Our users need learning resources but they won’t actively go to a company blog or search for tips. So we integrated our blog "visual learning center" into the dashboard as a pop up so they can reach for help on a variety of data storytelling and visual communication topics anytime from within the app.
In addition to user surveys, we also conducted one-on-one user interviews that helped us understand the psychographics of our users--what motivates them, what they are passionate about, how they define success, what their team dynamic like, a typical workflow, etc.
Insights from these interviews were particularly helpful for the questions unanswered from surveys, such as how to effectively segment our user base when they come from such diverse industries and job titles: They could be administrators at a non-profit organization, a sales person at an insurance company, a self-employed social media consultant, or a research analyst at a university.
We learned that a more effective way to segment our users would be on their needs and use cases, such as what goals they are trying to accomplish. For some it’s to engage their audience with compelling visuals, for others it’s to effectively communicate meaningful data to drive action. Based on this learning, we are developing content that is more geared towards these user needs: Not just to delight and entertain, but actually using content to help users get their job done.
Speaking of leveraging quantitative behavioral data, SaaS companies can look into user data analytics for conversion rate optimization. With user behavioral tracking tools such as Mixpanel or Kissmetrics, we can look at our customer cohorts behavioral trends and identify opportunities for optimization. At Visme, we already started segmenting user bases and pushing out customized notifications in the app. Instead of seeing generic notifications in their dashboard, users now get customized notifications based on the price plans they are on, their app usage, project type created, and more. We are already seeing an increase in free-to-paid conversions after implementing customized notifications.
As Tara-Nicholle Nelson, previous marketing manager for Trulia, shares on Firstround:
Find your customers' [micro-moments] and build content in response to these. Really hone in the specifics. What triggers them? What are they looking for? Where are they when the thought occurs to them? For example, at Trulia we found that when people were paid on the 15th of each month, they would check their bank accounts. Seeing their savings would trigger a search on the average size of a down payment. We were able to develop content that targeted a reader in that very specific moment, and it paid off with an uptick in email newsletter opens, blog post views and reader comments.
What’s your product’s strategy for micro-interactions? How are you designing a better user experience? Let us know in the comments below.
Title photo by [William Iven] via Unsplash. Habit loop graphic source: http://microinteractions.com/, graphic recreated with Visme. BJ Fogg behavioral model image by http://www.behaviormodel.org/.

