Sales has turned into a data-driven sport, carried forward by the unofficial slogan "If you can’t measure it, you can’t manage it." And now that email marketing is such a core part of the sales process, smart teams are tracking every available piece of data. Open rates, click-through rates, total subscriber count—they're the numbers that keep marketers awake at night.
But how do you know you're paying attention to the right numbers?
In many ways, our thought process around email marketing is broken. Most teams optimize their emails for clicks and opens, but lose sight of the goals that actually matter: leads and revenue.
The way that sales teams measure their success today is often misguided. Look at it this way: If your email campaign has a 90% open rate, but only drives one new purchase, the surface-level stats don't really matter. Opens aren't sales.
Marketing automation and reporting tools can give teams the data to power their growth engine, but you need to know what to focus on. Here's how to zone-in on the right email marketing metrics—tricks I used to grow the number of leads delivered to our sales team at Highfive (my former company) by 10x in just four weeks.
It's a three-step process:
Key Terms
Before we dive in, let's define a few of the terms we'll be using throughout this guide:
Email Marketing Funnel: In email marketing, the "funnel" is the process that recipients move through when they receive your message. For example, the process might start with your recipient opening your email, then clicking on a link, then signing up for a free demo of your product.
Open Rate: The percentage of people who opened your email after receiving it. You can calculate open rate by dividing the number of people who opened an email by the number of people who received it.
Response Rate: The percentage of people who replied to your email after receiving it. Response rate is calculated by dividing the number of people who responded to a message by the number of people who received it.
Identify the Right Metrics to Focus on
Businesses aren’t valued on the number of emails they persuade prospects to open. They're valued on how much money they make.
Before you write email copy, connect with prospects on LinkedIn, or start any other sales activity, it’s important to understand which metrics matter most. Do raw connections matter? Is it more important to have a thousand contacts or a million pageviews?
What's the real goal you're after?

Let’s look at an example: Pretend that we run a software company, and we sent an email campaign to 200 prospects last week. 100 of them got Campaign 1, and 100 of them got Campaign 2.
At 80%, the open rate for Campaign 1 is twice as high as it is for Campaign 2. Sure, we used a clickbait-style subject line that doesn’t represent the true contents of the email. But we also got a 20% response rate. Success!
Or, maybe not. Let’s see how things progress through our funnel: When we review the open rate and response rate—the metrics most email campaigns would look at—Campaign 1 beats out Campaign 2.
It looks like an instant success; until you consider that Campaign 1 said something like, "Am I bugging you?" and 20% of recipients jumped at the opportunity to say "YES" in all caps.
Let's dig into the important numbers instead: Demos Set Up, and Revenue. Those measure how many sales calls we set up, and how many subscriptions we sold, respectively.
At the demo stage of the funnel, something interesting happens. Campaign 2—the one that appeared to be lagging—outperforms Campaign 1 by 100%; four people said they were willing to talk, versus two from the first campaign.
And more demo calls mean more sales: Campaign 2 led to two-times amount of revenue. To be clear: If we switched from Campaign 1 from Campaign 2, we'd double the amount of money we make off of each prospect.
This comparison illustrates why I have to refrain from screaming whenever salespeople boast about their response or open rates. The metric you must track in all outbound email campaigns is revenue. All the other metrics support it.
When you're running email campaigns, it's important to measure success by the strength of your funnel. Every step in the process—an open, a click, a response, a sales call—should move you one step closer to more revenue, and each one is a lever you can pull.
The metric you must track in all outbound email campaigns is revenue. All the other metrics support it.
It's not that sky-high open rates and massive mailing lists are bad—it's just that they're secondary to revenue. For example, if you aren’t getting any responses, you can check to see if it’s because no one is opening the email by looking at the open rate. If you’re hitting the average open-rate benchmarks for your industry, then you should consider changing the copy of the actual email and leaving the subject line constant. In this way, benchmarking with basic stats can help you understand which areas of the funnel you should optimize first.
Now let’s say you're getting responses, but none of them are asking to see a demo of your product. If they're all saying "I’m not interested," you may need to re-evaluate who you’re targeting.
Focus solely on the Demos Set Up metric, and brainstorm three tests that you can run to increase this number. For example, if you’re emailing Fortune 500 companies, try emailing mid-market companies.
The metrics for your business may be different—you might need to focus on the number of trial accounts created, calls placed by customers, appointments booked, visits to your brick-and-mortar store, or anything else that drives your company's revenue. But whatever you choose to track, make sure it's a revenue-driving metric.
It’s important to note that there is little reason to optimize the secondary metrics (open rate, response rate, etc.) unless you believe it will lead to more revenue. If improving your open rate leads to more responses that in turn convert to demos, go for it. But optimizing for high open rates without any idea how it trickles down the funnel is foolish.
Businesses aren’t valued on the number of emails they persuade prospects to open. They're valued on how much money they make.
Review and Report on Those Metrics
In order to optimize for the right metrics, you’ll need to track your progress consistently. A focus on tracking will turn improvement into a habit, and not just a fleeting idea.
One great way is to make a weekly report, and share it with your team. In my last job as a sales development manager at Highfive, I created a weekly report for our team that went through each stage of the funnel. The contents of that report were simple: I mentioned what I tried that week, then compared the following metrics to the last week’s report:
Accounts targeted
Prospects emailed
Emails sent
Responses
Demos
Pipeline
Revenue
In these reports, it's important to measure the week-to-week change, then identify which activity affected that change. For example, if "prospects emailed" decreased dramatically, and "demos booked" increased, you’ll want to know what accounted for the increase in efficiency so that you can replicate it.
Today, we use the same reporting system at SimpleData. We use PersistIQ—an app for tracking cold leads and turning them into sales prospects—for the top of our funnel. For the rest of the funnel, we lean on SalesforceIQ—a CRM focused on turning leads into paying customers.
Here’s a look at one of our recent email marketing campaigns, and its results throughout the funnel in one of our PersistIQ dashboards:
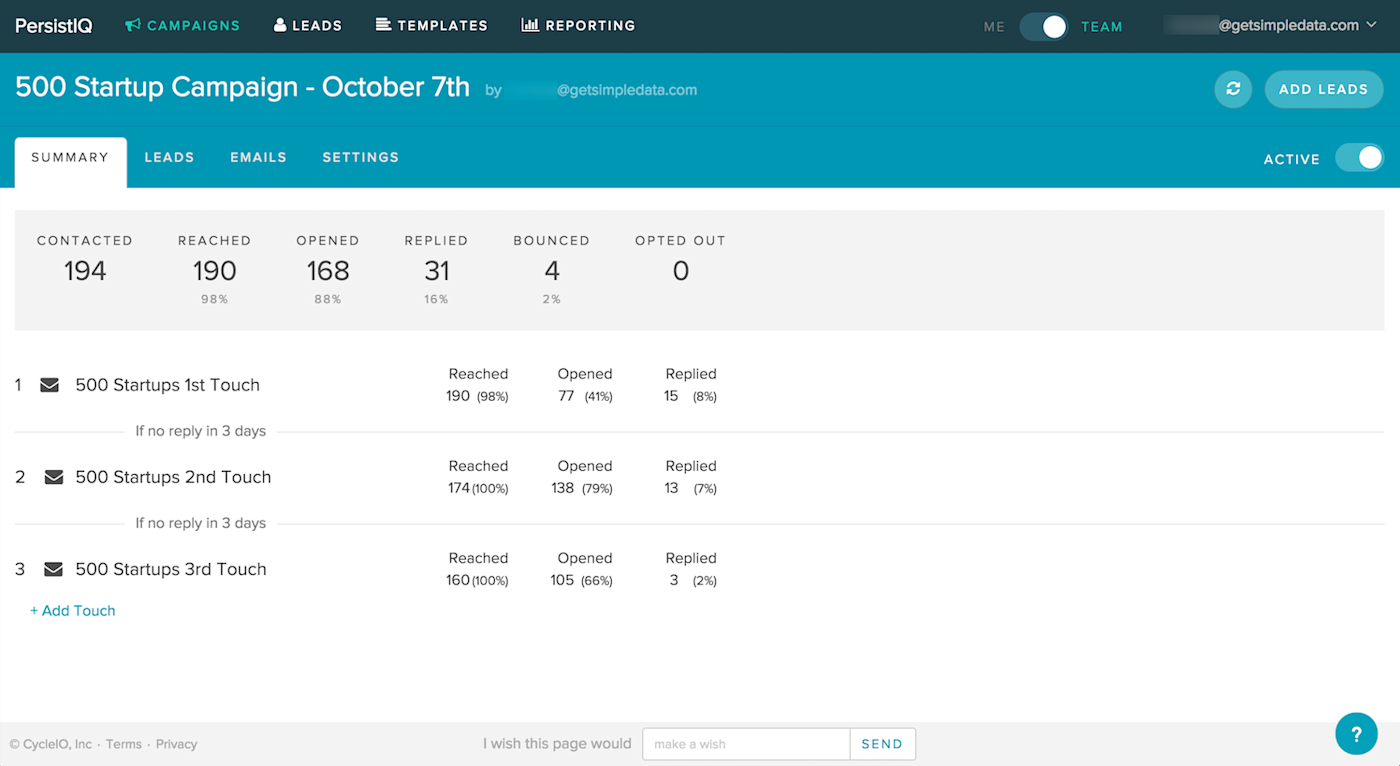
Here you can see the total number of people contacted (194), how many opened our emails (87%), and how many replied (16%). But these numbers only tell half of the story. Remember: a business doesn’t exist to get prospects to open an email—it exists to close sales and make money.
In order to measure the success of this campaign, we need to look in our SalesforceIQ CRM to see how well the campaign performed through the entire funnel, which you can see in this next dashboard.
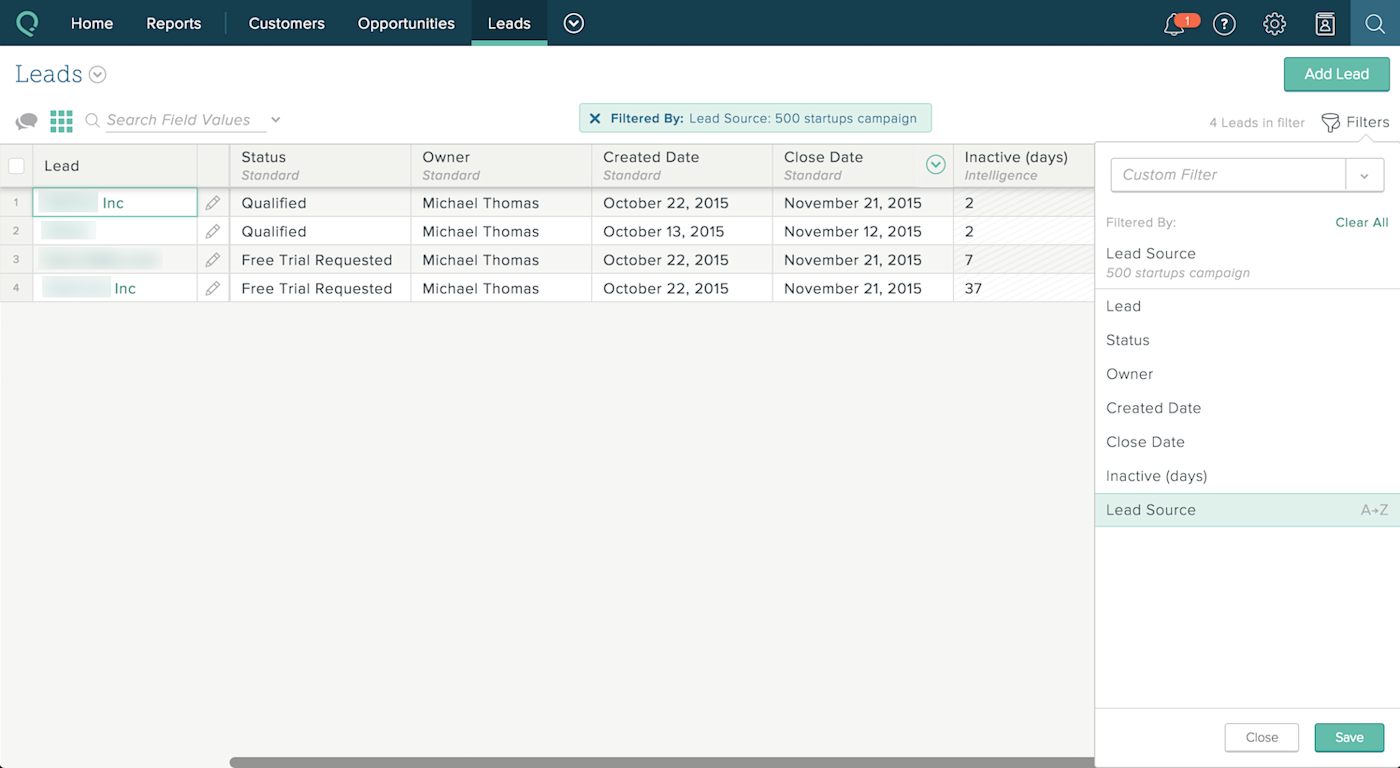
Of the 31 people who replied to my emails, only four became leads—that means four people expressed interest or booked an appointment to learn about our service. With the first dashboard, you may have been thinking, "Teach me how to get a 16% response rate!" but by now you might be taking that back—only 2% of the people that we emailed wanted to learn more about our service.
But this still isn’t enough to measure the success of the campaign. We need to understand how many opportunities and closed deals came from this campaign.
Here’s a look at the "Opportunity" tab in our SalesforceIQ account, filtered for this campaign:
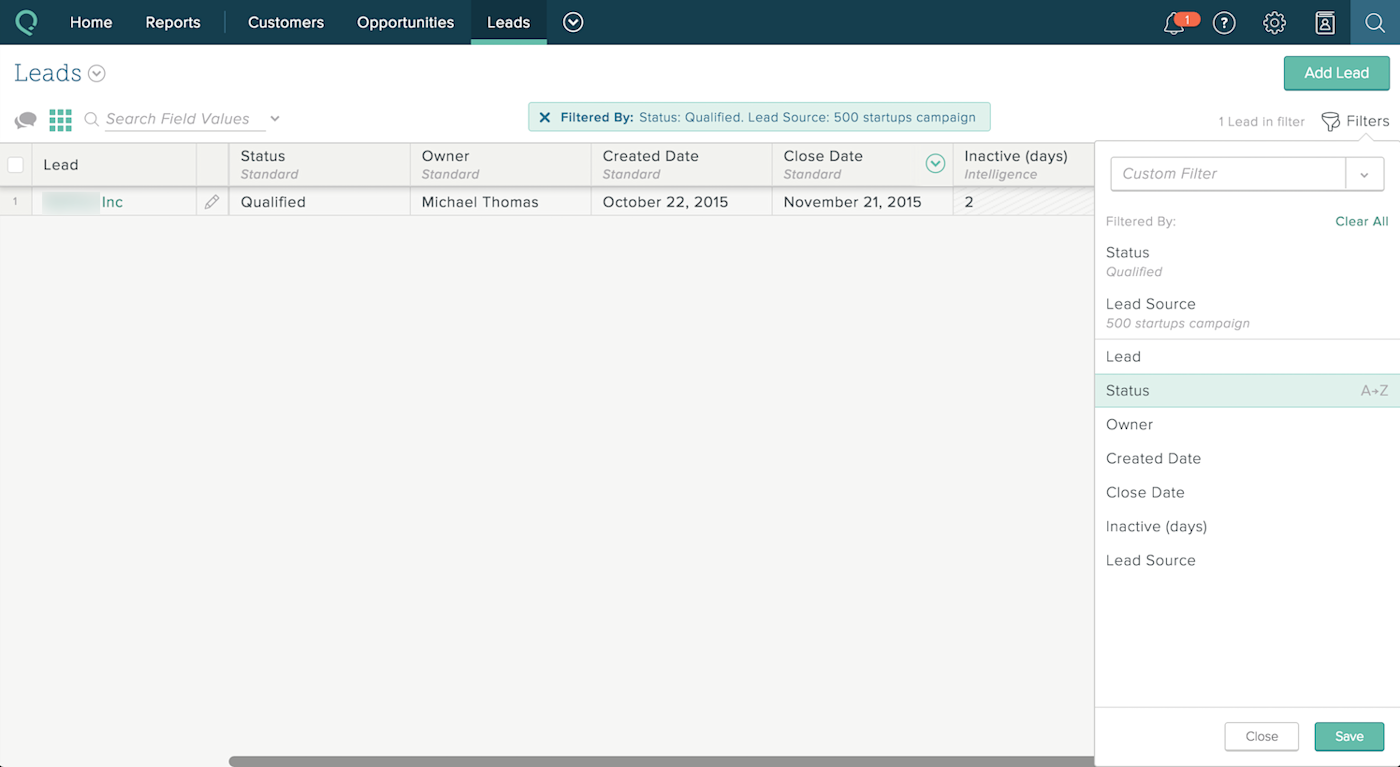
Of the four people who converted to leads from this campaign, only one turned an opportunity—someone who has a high likelihood of buying from us. And, as of the publish date on this piece, that deal hasn’t closed.
So a campaign that looked great at the top of funnel turned out to be a flop. But it wasn’t until we looked at the full picture that this became apparent.
Perhaps it'd be more encouraging to look at a successful campaign, but the negative results from this campaign drive the message home: A campaign can look more or less successful depending on which metrics you look at. If you focus only on open rates, this would look like an incredibly successful email campaign. Digging into the stats that drive revenue, though, show that this campaign was a failure.
Focusing on open rates might drive us to double-down on a campaign that isn't producing real results. Focusing on sales, though, shows us that we need to go back to the drawing board.
Choose the Variables to Optimize in Future Campaigns
In order to be a great salesperson, you must first become a great marketer—that seems obvious, but it's easy to overlook. You don’t need to go off and write blog posts or tweet 12 times a day. You do, however, need to think about your activity in terms of campaigns. Try something, see what works, then improve what doesn't—and try again.
Great salespeople and marketers are great experimenters. They come up with a hypothesis and test it. But in order to experiment effectively, you'll need track every experiment from start to finish. That's where visual organization tool like Trello comes in handy: At SimpleData, we use a Trello board with four lists to keep an eye on our experiments and collect meaningful results:
Backlog of tests: where all the shiny new ideas go throughout the week.
Testing: where we track active tests.
Failed tests: where failed campaigns end up, so we can avoid actions that didn't work.
Passed tests: where campaigns go when they’ve passed an initial test. Once a test makes it to this list, we make it an ongoing marketing program.
Here’s what that looks like:
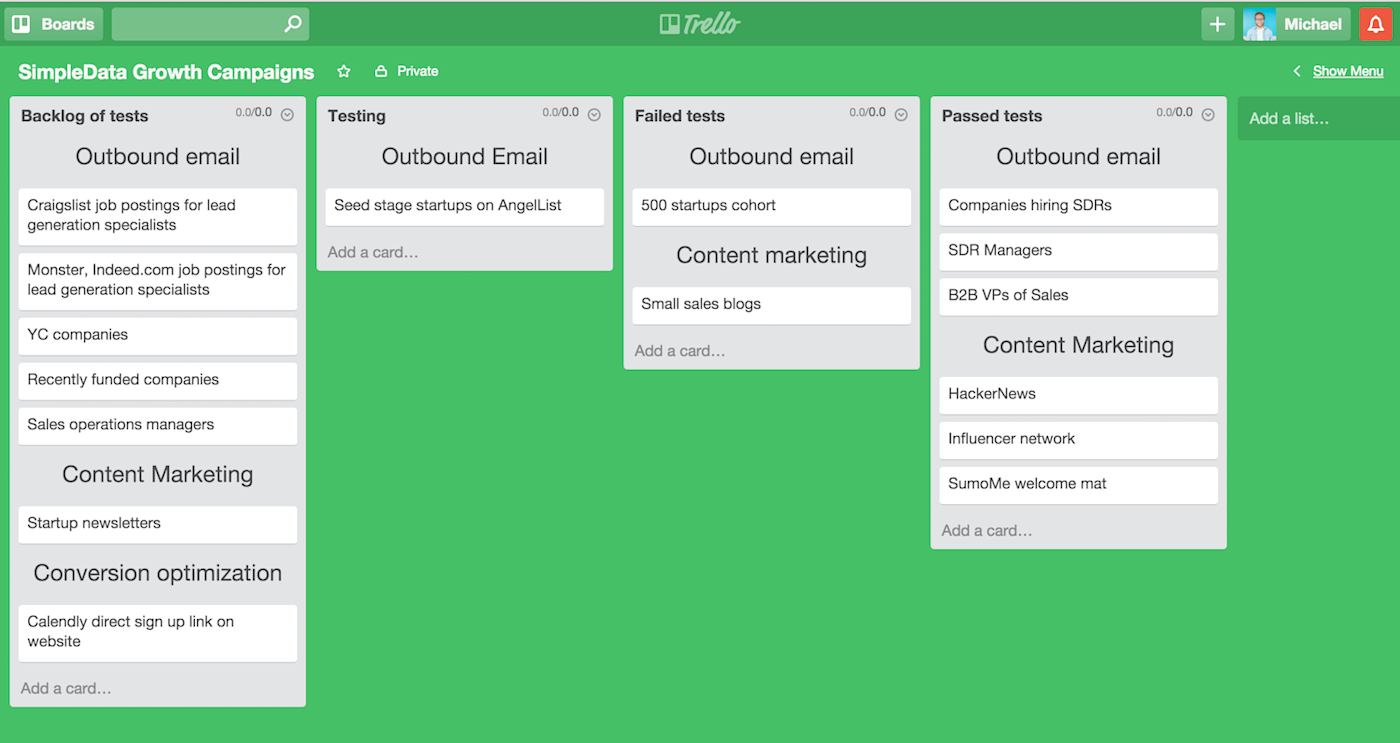
Recently, someone on our team came up with an idea to test: he suggested we send marketing emails to sales VPs at companies that had open job positions for a sales development representative. Since our business helps companies outsource part of their sales development process, it made sense that anyone hiring for this position would be a good prospect to use our service as well. But we needed to test the idea to see if it really worked.
The results: Our open rate was average, and almost no one clicked on our links. But we didn’t care. As it turned out, that campaign was a runaway success based on the metrics we were optimizing for: it sparked 10 conversations, $78,000 in pipeline revenue and $4,800 per month in net new monthly revenue. And now this particular campaign is a repeatable outbound strategy that we’ll use for the next 6 months—we'll find sales jobs posted on sites like LinkedIn, Craigslist, and Indeed.com, then turn those contacts into new leads.
Your email marketing strategy should be far more than catchy headlines and GIFs that make you laugh. It should revolve around data-driven campaigns, focused on the metrics that help your company grow.
So don't worry about your open rate, or even your list size. Instead, try focusing on that one stat that matters most: revenue. Optimize for that, and your email marketing will be a success, regardless of how your vanity stats look.
Learn More about Email Marketing
Once you've found the perfect metrics to target in your email marketing, it's time to hone your campaigns to target those metrics—and find the perfect app to send out your emails. In Zapier's free Ultimate Guide to Email Marketing eBook, you'll learn which apps to use to send your emails, how to create great messages, ways to automate your email marketing, and much more.
It's the guide you need to take your emails to the next level.


