I'm a big fan of sticky notes. There's something so satisfying about visually mapping out ideas and processes in good old-fashioned paper and pen in bright colors. One downside: they're hard to share with coworkers who may or may not appreciate you gesturing wildly at a wall in your kitchen covered with Post-its.
For cases like this, flowcharts in Google Docs are the next best thing. It's the same kind of visualization tool—but in a clean, digital format.
Table of contents:
What are flowcharts?
A flowchart is a diagram that explains a process or shows how something is structured, like data sets or organizations. They're designed to help people understand the steps of a process by reducing explanatory text and using simple images instead.

Visuals aren't Google Docs' strongest suit, so if you regularly need sophisticated, complex flowcharts with high-level design functionality, you might want to use dedicated flowchart software. (More on that later.)
How to create flowcharts with Google Drawings
Whether you want to spruce up a report you created in Google Docs or add a flowchart to another kind of document, the Google Drawings screen in Google Docs will be your home base for building a flowchart.
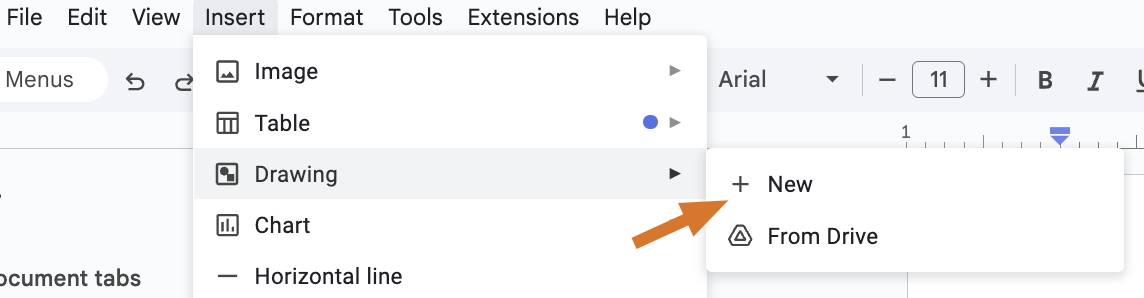
Create a new Google Doc, and click Insert > Drawing > New to open Google Drawings.
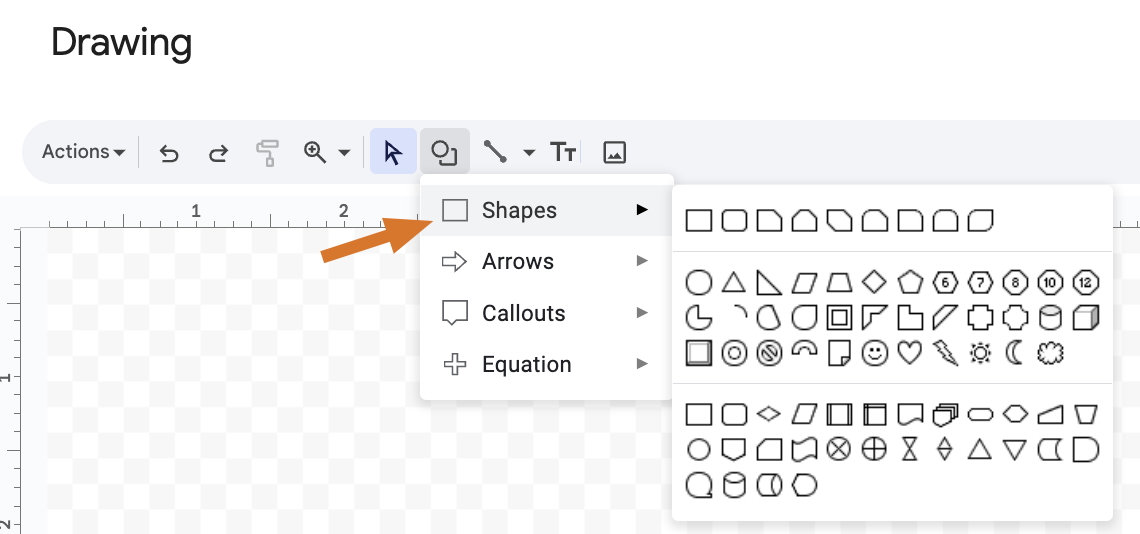
Click on the Shapes icon, and drag the shapes you want into the drawing area, then use the paint bucket tool to color in the shapes.
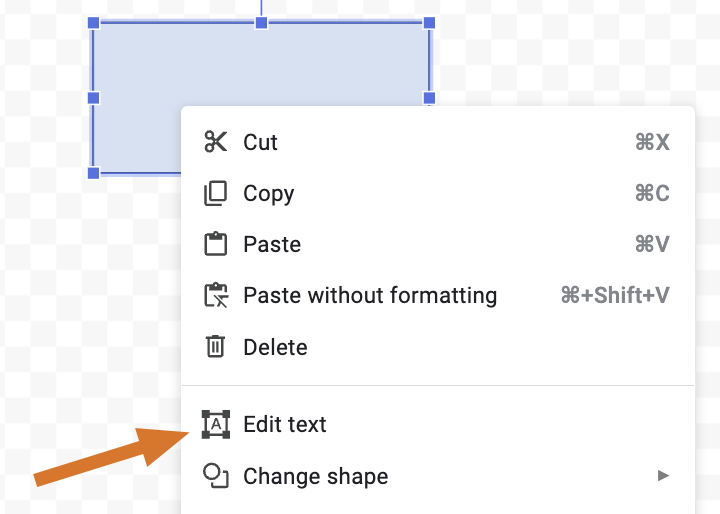
Right-click on the shape and click Edit text to add text.
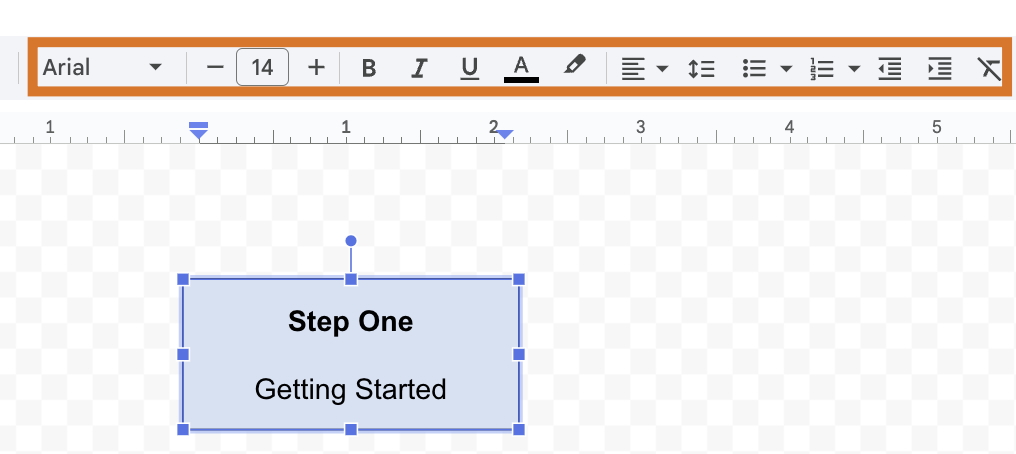
Edit the text by using the tools at the top of the drawing box.
Arrange the shapes you've made to create a logical flow, then use the Line tool to draw straight, elbow, or curved lines between them.
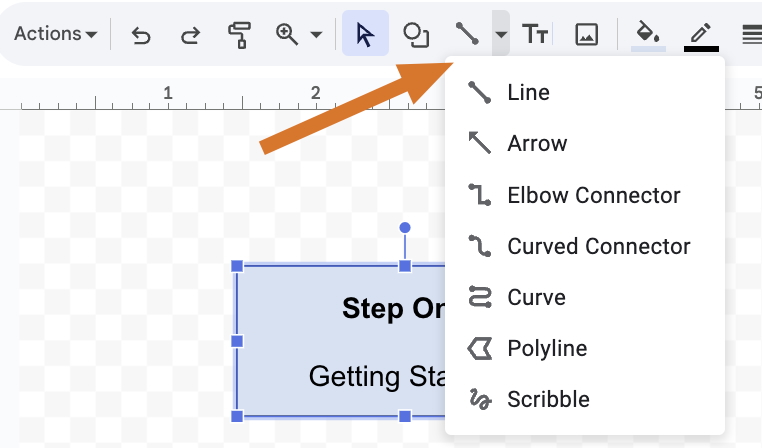
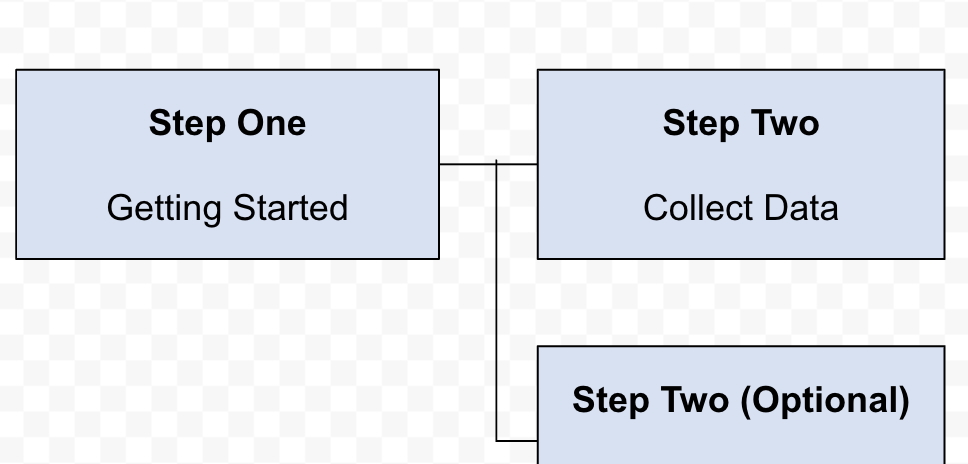
If you have optional or conditional steps, you can branch them off by connecting lines to other lines.
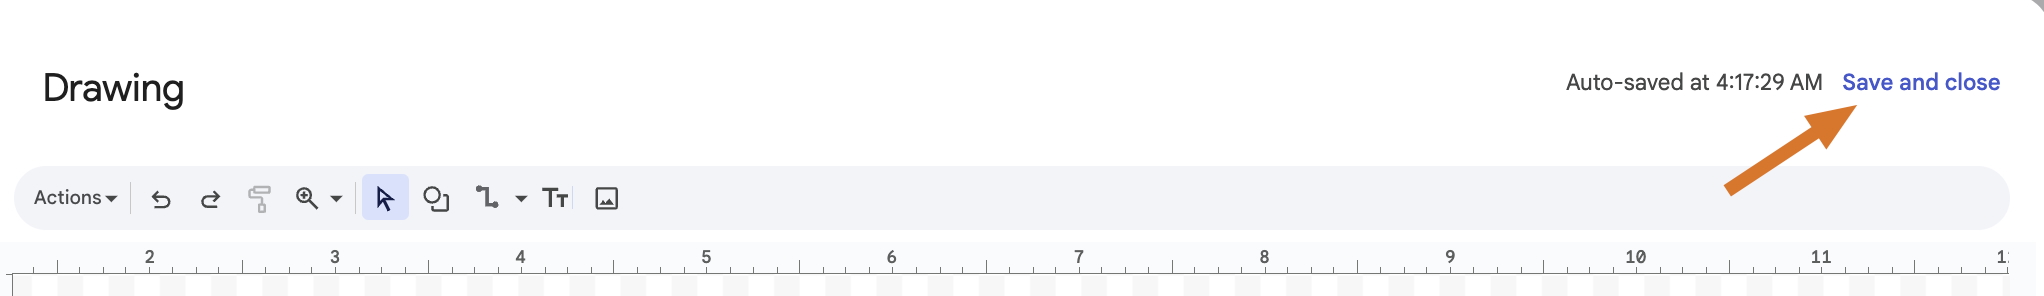
Click Save and close in the top right of the drawing window.
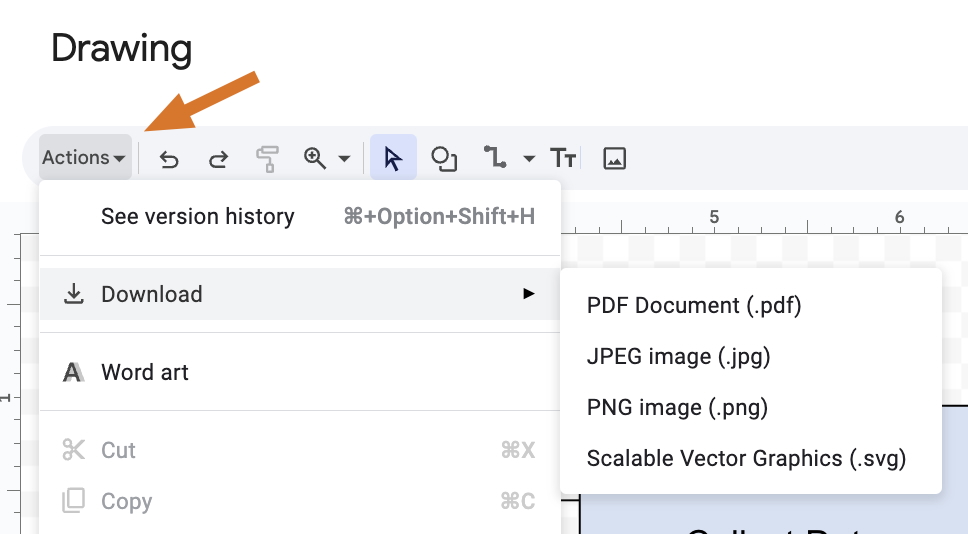
The Google flowchart will now appear as an image in your Google Doc. To download your image, click Actions in the drawing window, select Download, and click the file type you need.
If you need to make changes to your flowchart, just click on the image and click Edit.
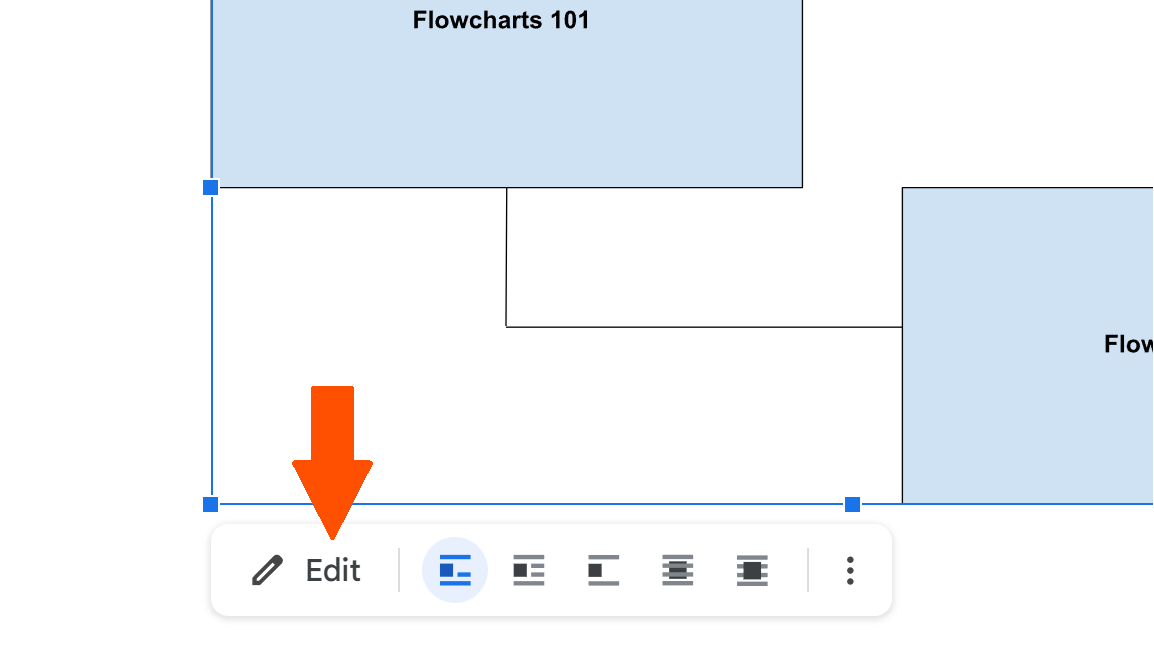
This will open the drawing window again.
Tips for effective flowchart design
As powerful as a flowchart can be, it's also easy to make them too complicated. The temptation to add just one more step calls like the dark side of the Force—so stick to these steps for simpler charts.
Set your document to landscape
If you want your flowchart to have more space to expand from left to right, go to File > Page setup, then select Landscape (horizontal).
Use color coding to differentiate steps
Color is one of the best ways to make your flowcharts clear—so long as you're using the right colors. Here are a few ways you can use color to add value, not detract.
If a flowchart outlines several processes, use one color for each process or color-code step numbers.
If you're building an organizational chart, use one color for all people or departments on the same level.
For decision-making flowcharts, include straightforward colors to show people where to stop (red) and where to continue (green).
Change the color of your flowchart elements by clicking on the paint bucket icon in Google Drawings.

Keep text concise
Flowcharts are best when they're as concise as possible, so speak softly and limit character count. If something needs more context that would make your text unscannable, don't be afraid to just drop a link to a resource and keep on trucking rather than overexplaining.
If you're having trouble consolidating your text, copy and paste the text into Gemini and ask it to generate a shorter version of the text with the same meaning. (Unfortunately, you can't do this directly within Google Drawings.)
Maintain consistent spacing and alignment
Like library books on a shelf, flowcharts look best when they're even and aligned. The Google Drawings window makes it easy to maintain consistent spacing and alignment. Use the rulers on the top and side of the window (along with the grid in the background) to keep your shapes evenly distributed.
To keep the elements of your flowchart consistent, just copy and paste shapes and change out the text.
Learn when Google Docs might not be enough
Google flowcharts are great when you need to put together a quick diagram—but there are some limitations.
If you need to build a very complex chart, you might run out of room on the drawing screen.
If you need a flowchart that looks as professional as possible, Google Docs might not be the best option. You can't link URLs or other Google Docs in shapes on a Google Drawings flowchart. This can be really limiting, especially if you want a flowchart that doesn't look cluttered.
If creating flowcharts is a big part of your work life—sounds fun!—you might want to consider other tools designed specifically for flowchart diagramming.
Automate team collaboration with Zapier
Now that you know how to create a flowchart in Google Docs, the next time you or a teammate needs to provide a dazzling visual to accompany a process document, you'll be able to hit the ground running.
If you're ready to level up your relationship with Google Docs, consider integrating Google Docs with the other programs you use on a regular basis. With Zapier, you can set up automations to create documents from raw text, append new text to documents—like reports—or even trigger workflows based on new documents.
Learn more about how to automate Google Docs, or check out some these popular Google Docs automations.
More details
Zapier is the most connected AI orchestration platform—integrating with thousands of apps from partners like Google, Salesforce, and Microsoft. Use interfaces, data tables, and logic to build secure, automated, AI-powered systems for your business-critical workflows across your organization's technology stack. Learn more.
Related reading: