Making a flowchart in Excel can feel like making bread with a sourdough starter: complicated and all too easy to turn into an Eldritch horror. But if you use Excel for everything else and insist on building your flowcharts in it, too, there are ways to make it work.
Here's everything you need to know to make a flowchart in Excel—as well as a few alternatives you can use to better meet your goals (and avoid feeling like you're in a Stephen King novel).
Table of contents:
Common Excel flowchart elements
Since you're committed to wading into the Excel waters, let's get a little more familiar with how you'll turn a spreadsheet app into a flowchart maker. These are the most important elements you'll find in Excel flowcharts:
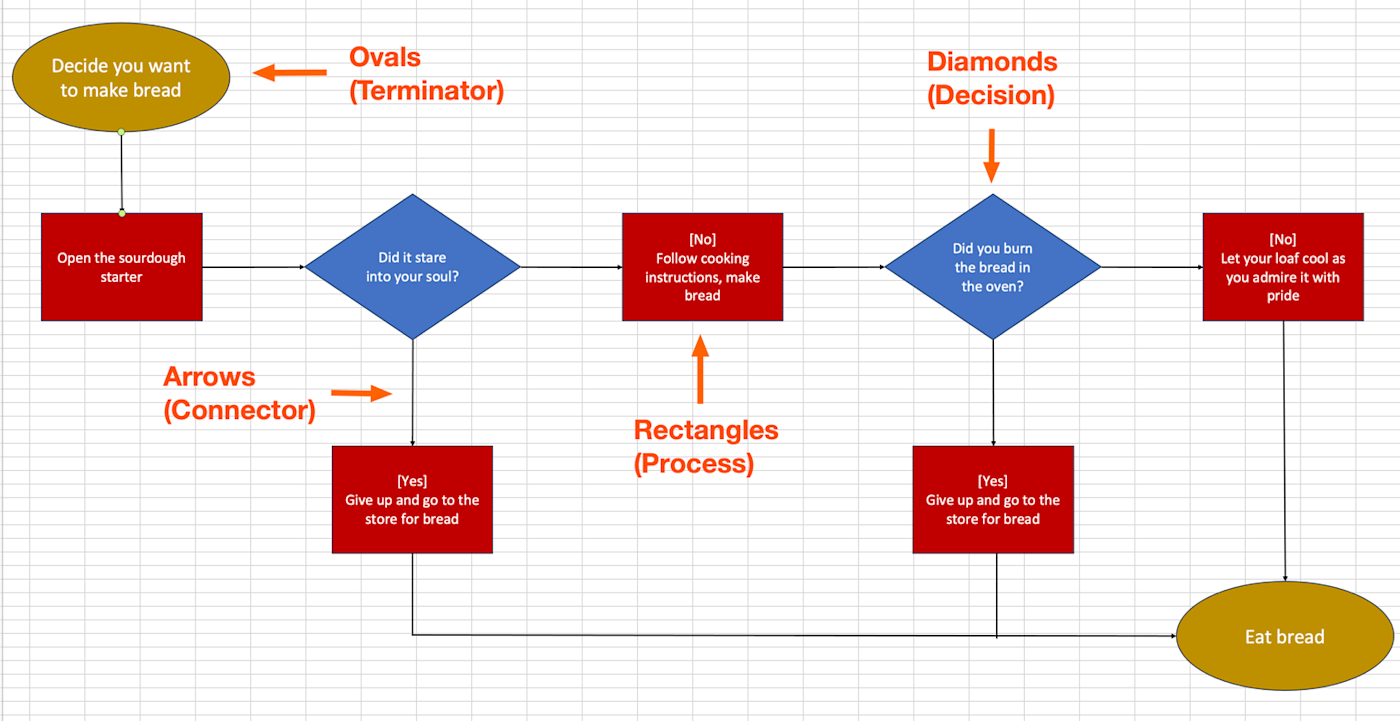
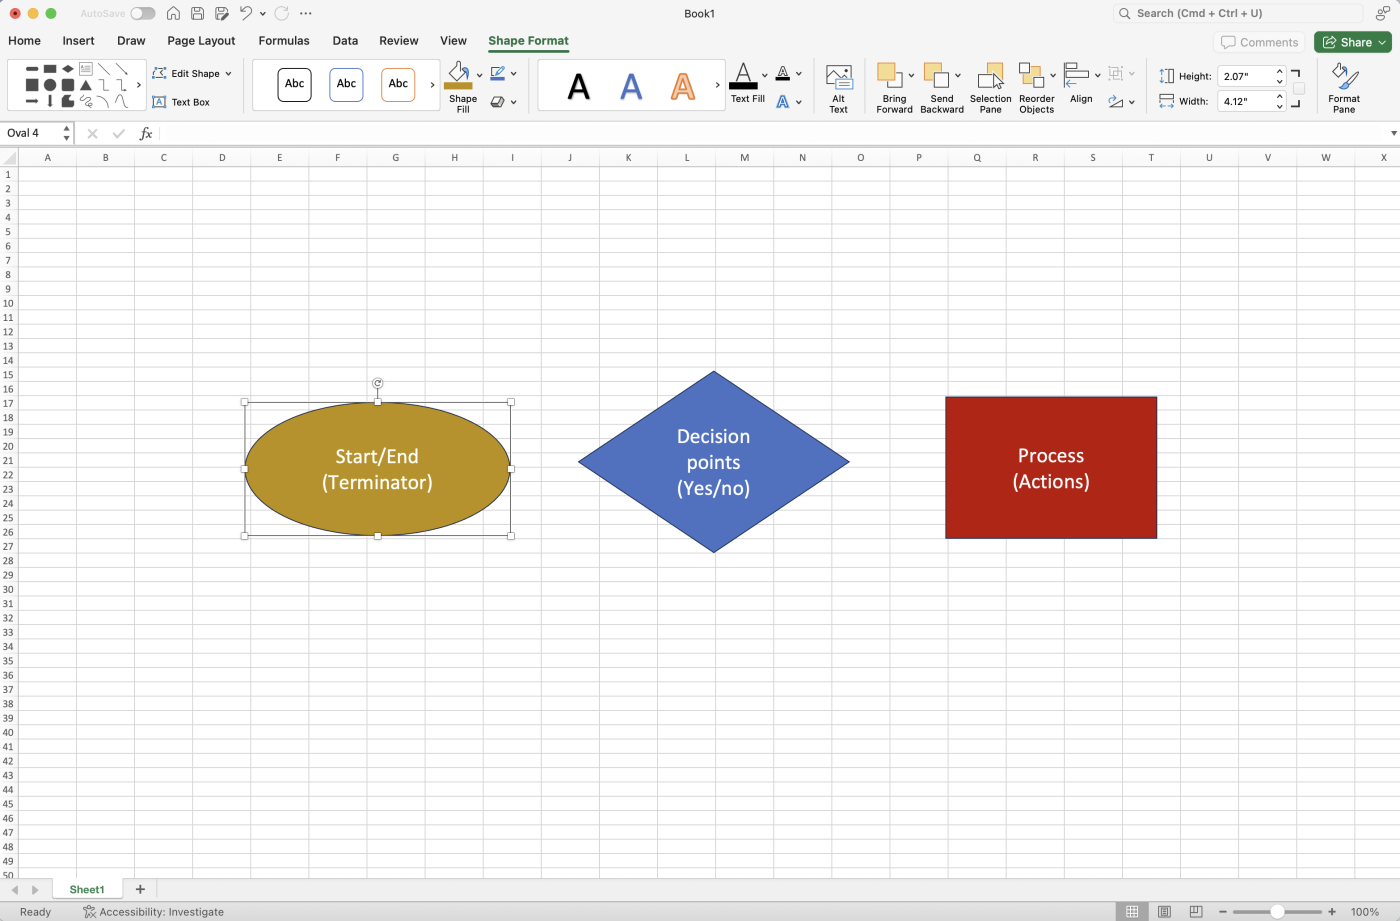
Ovals (Terminator): The beginning and end points of your flowchart. In these elements, you may find instructions like "Start the meeting" or "Customer submits payment."
Rectangles (Process): A specific process or action to be performed—things like "Calculate today's revenue" or "Send an email to the manager."
Diamonds (Decision): Decision points that may pose a question or facilitate a yes/no answer, like "Did the customer provide payment?" or "Has the budget been approved?" There are typically two paths branching out from these points, representing each possible answer.
Arrows (Connector): Directs the flow of the chart and keeps the user moving from one step to the next.
How to make an Excel flowchart
You can create a flowchart in Excel with a few steps:
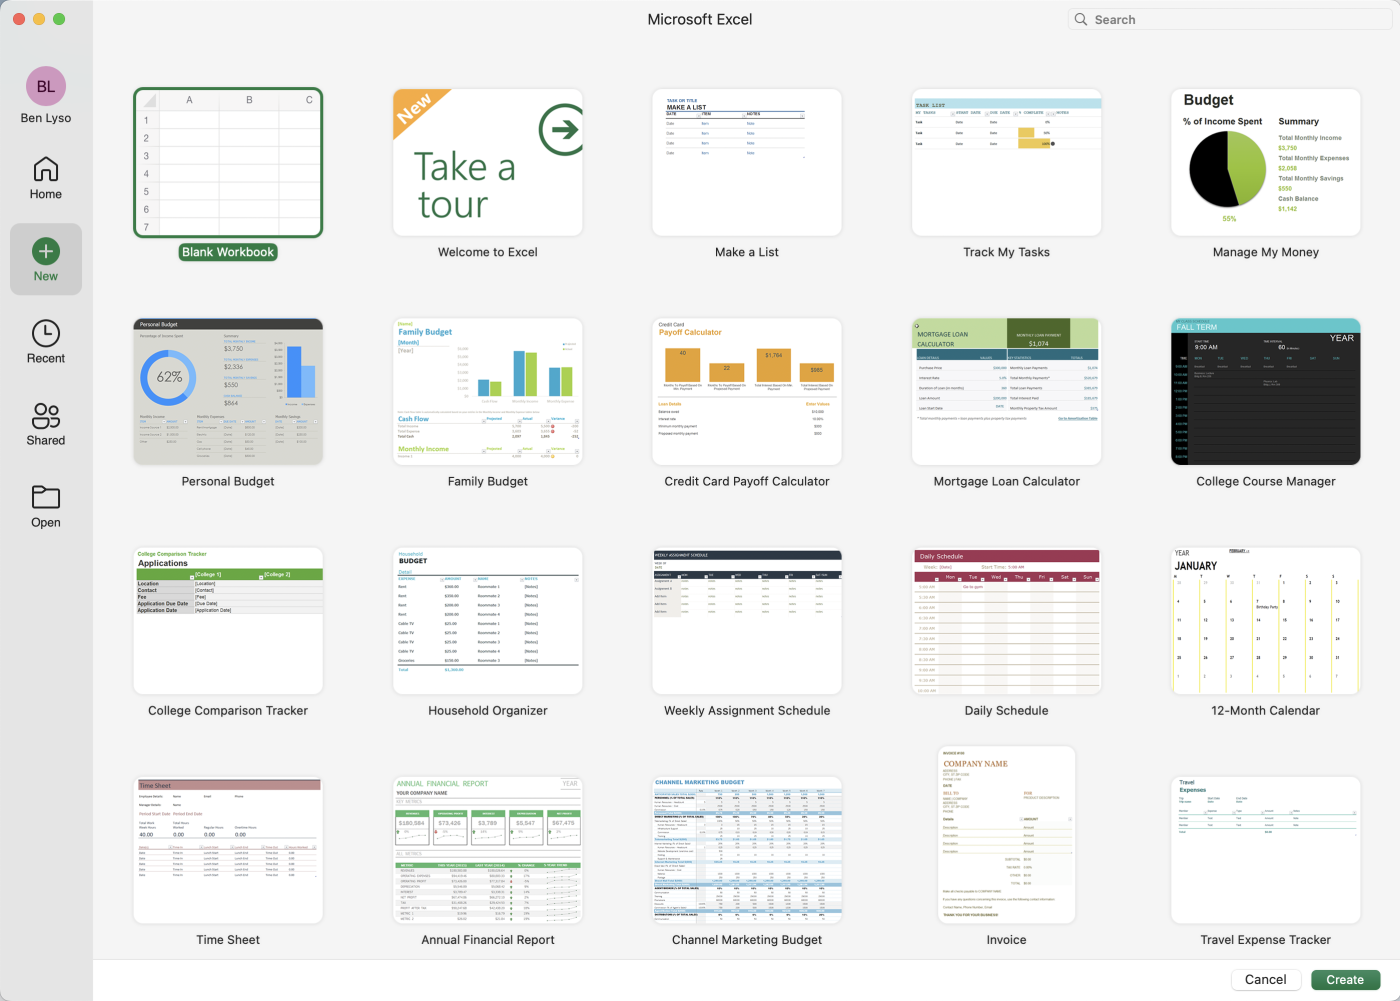
Open a new book: Excel offers several different templates, but the easiest starting point for a flowchart is the Blank Workbook option.
Add your shapes: Under the Insert tab, you'll find the Shapes tab. From here, you can find all the elements you'll need—there's even a handy Flowchart section.
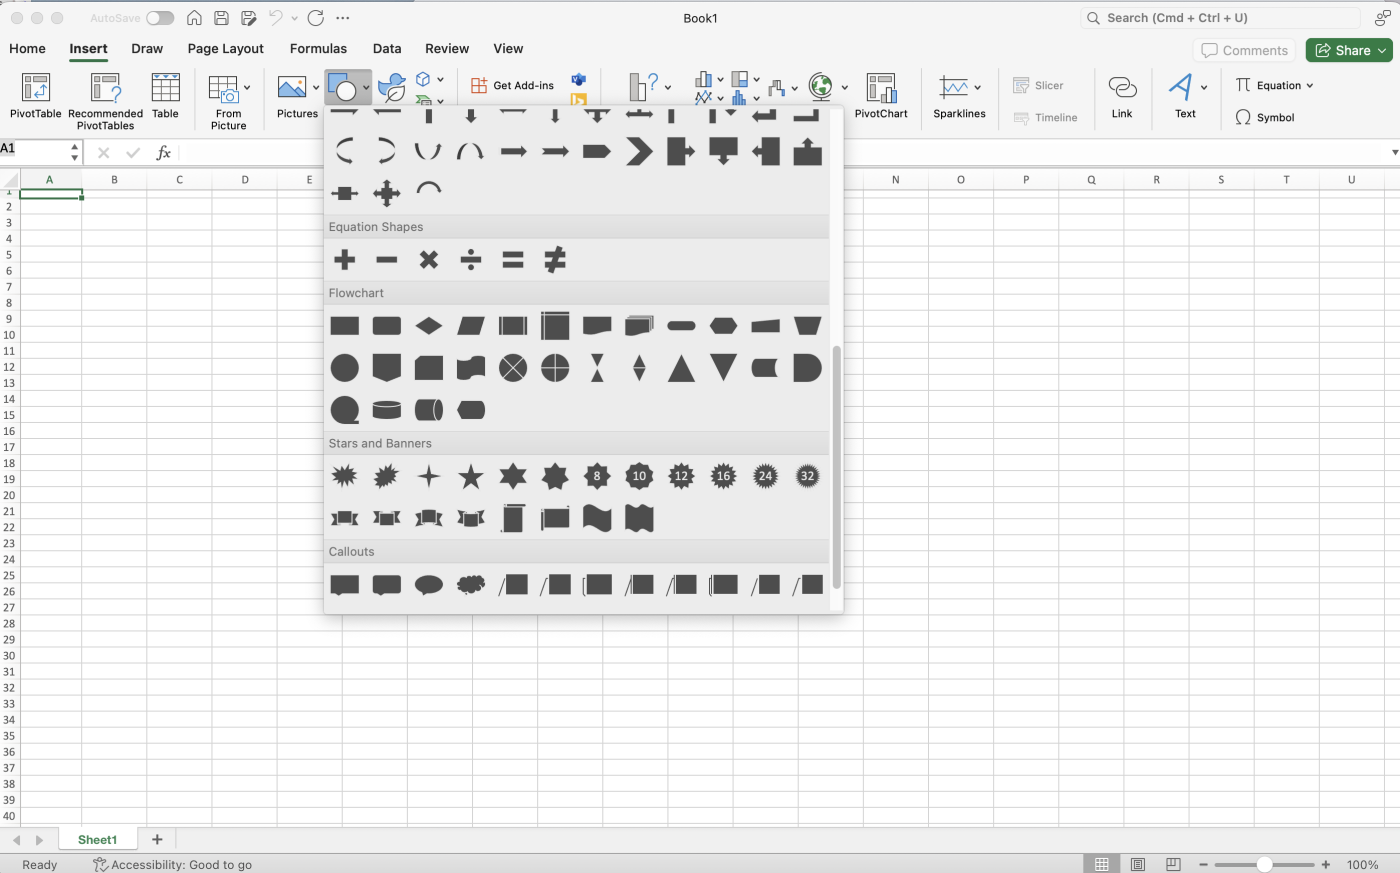
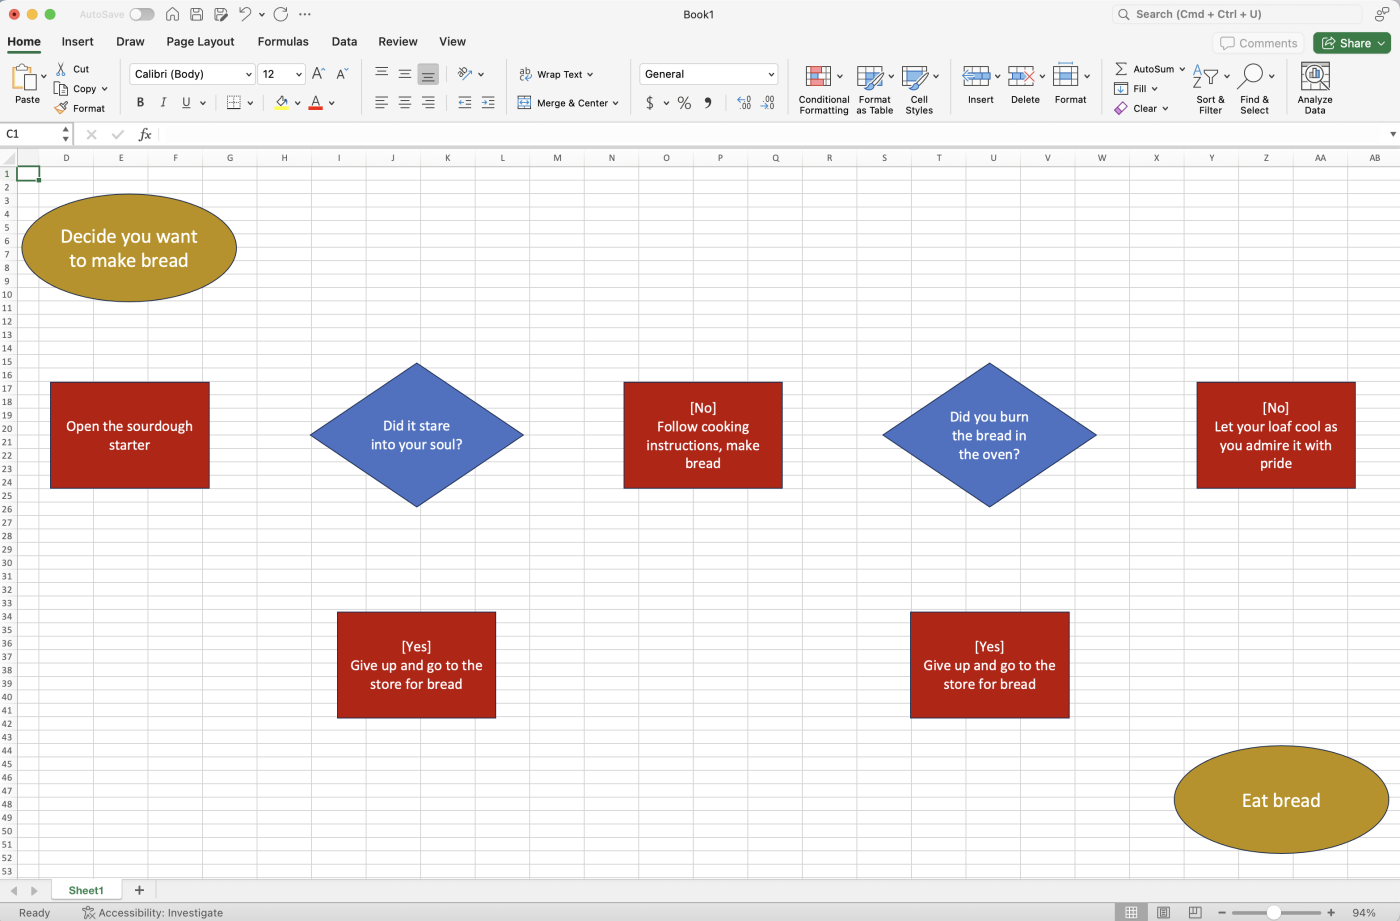
Add your shapes to the document: One by one, click the shapes to add your ovals (terminators), diamonds (decision points), and squares (process). When you select each shape, you can access the Shape Format tab at the top of the document, which allows you to add text and change the colors with just a few clicks.
Set up your flowchart: Arrange your workflow or process how you see fit—you can do this by dragging your shapes around your workbook. Make sure the steps are in logical order so the flowchart makes sense.
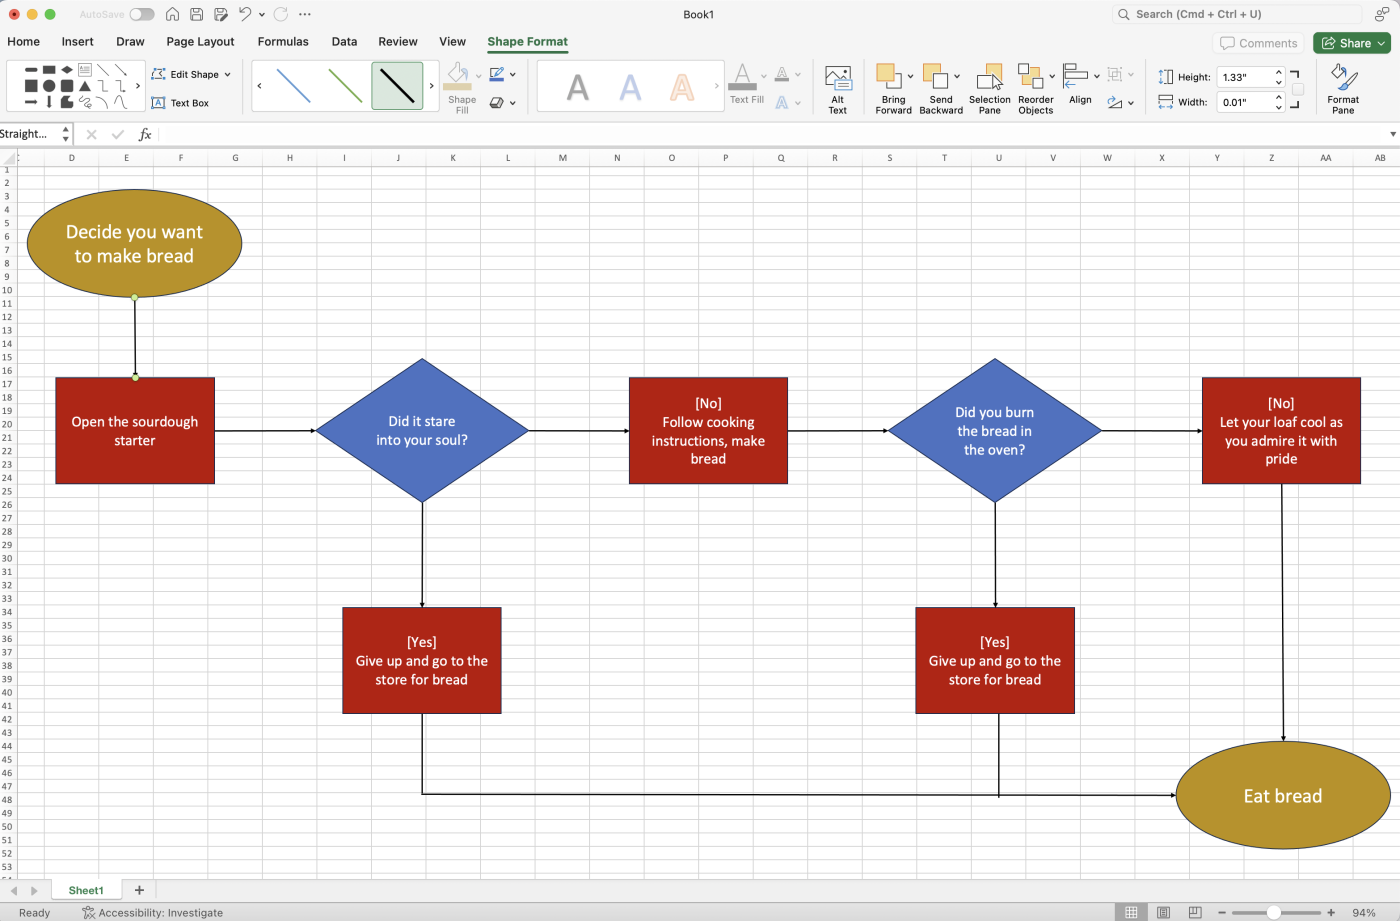
Add the lines: Once you've established your steps, all that's left is to add the lines. You can find lines in the same Shapes tab where you found the shapes. Select the line, click once on the workbook to start drawing your line, and click again to end once it's as long as needed. You can even snap the line directly to your shapes. And, once you insert a line, you can change the color and thickness in the Shape Format tab at the top of the document.
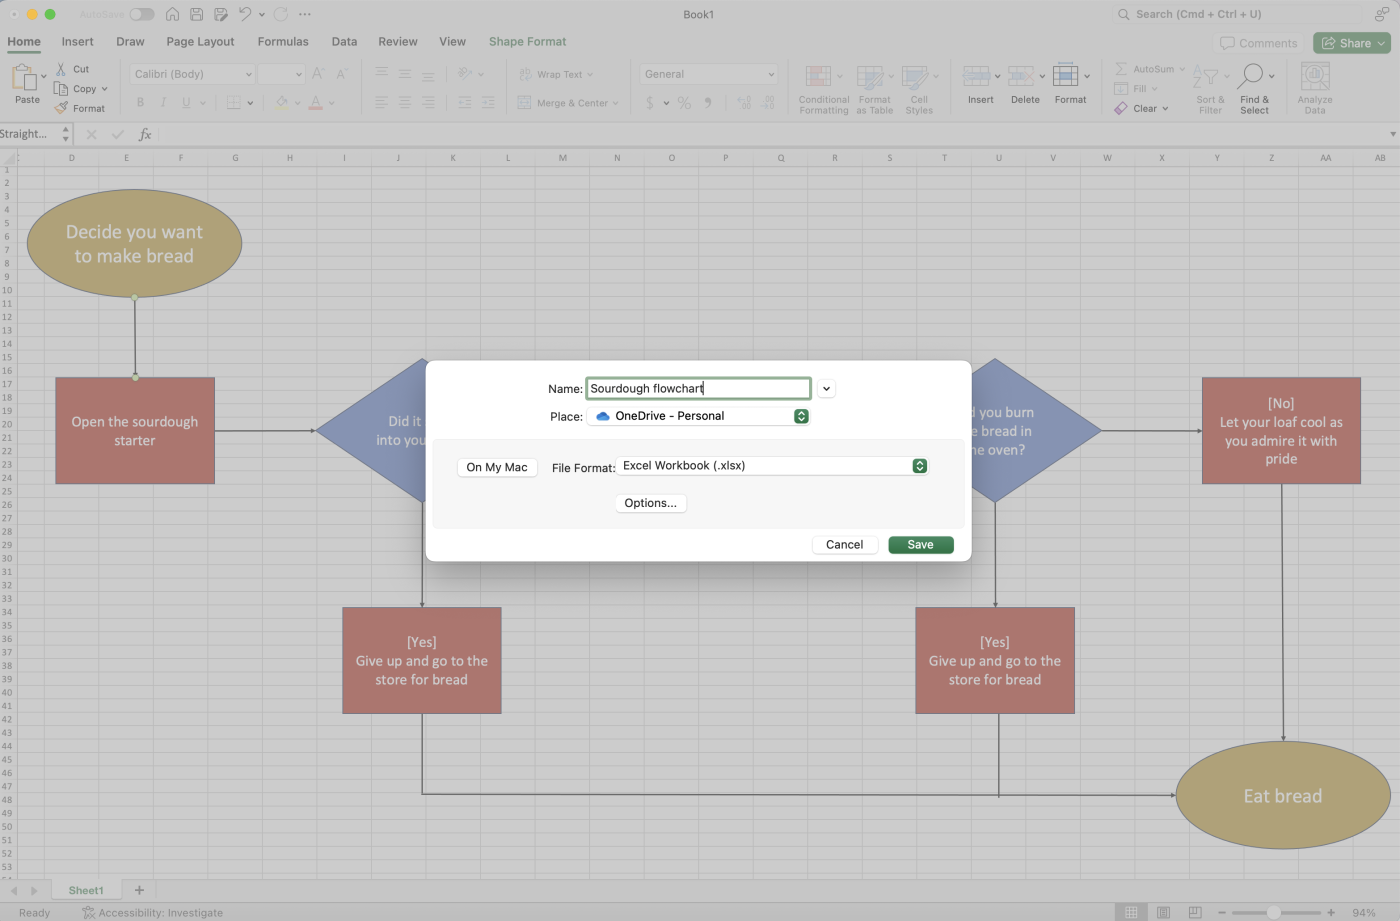
Save your masterpiece: Finally, save your document and use it whenever you like.
Alternative ways to create flowcharts
Excel is just one of the many ways to create flowcharts—and in my humble opinion, it's one of the most cumbersome. It took me longer than I'd like to admit to create the example above, all the while having to endure painful flashbacks to my nightmare in the kitchen.
The far better option is to use flowchart software for all of your graphical needs. These tools come with smart layouts, advanced customization features, workflow management tools, sharing options, and more that almost make it fun to create flowcharts. Using Excel to do so, admittedly, is not.
If you're flowcharting your workflows, try Zapier Canvas—a free diagramming tool that you can use to create flowcharts, connect with your team, and expand on your ideas with AI and automation. What makes Zapier Canvas special is that once you've mapped out your ideas, you can automate them right from the same platform—helping you go from ideation to actual action.
Automate Excel
Flowcharts are valuable tools that teams can use to work through problems, assess workflows, and even help them with their own episode of "Kitchen Nightmares." I don't recommend Excel as the best way to make a flowchart, but if you use Excel for everything else, then I understand the need for consistency.
And if that's the case, Zapier can help you automate Excel, so you can connect it to your CRM, project management software, and any other tools you use. Learn more about how to automate Excel, or get started with one of these pre-made workflows.
More details
More details
Zapier is the most connected AI orchestration platform—integrating with thousands of apps from partners like Google, Salesforce, and Microsoft. Use interfaces, data tables, and logic to build secure, automated, AI-powered systems for your business-critical workflows across your organization's technology stack. Learn more.
Related reading: