Humans love patterns—in fact, our superior ability to process patterns is what sets us apart from other species.
We still need help drawing conclusions from data, though. That’s where reports come in: They provide a visual overview of information, From summarizing work expenses to recapping research findings, reports help sort connect the dots.
But no one has the time to dig through data, make charts and lists, and turn every single project and activity into a report. That's where these 24 apps can help—they create reports for clients, team, and yourself in minutes.
The Best Tools to Build:
Graphical Reports for Clients
You've worked hard to land a new client, and need a presentation that will close the deal. Or maybe you've labored over a client's project for a month, and need a quick way to show the progress you've made.
Text won't cut it. You need a visual report that turns numbers something that everyone will understand at a glance. For those times, these are the apps to use.
Sushi Status
Let’s face it: many clients and team members will merely skim your status report, or even ignore it entirely.
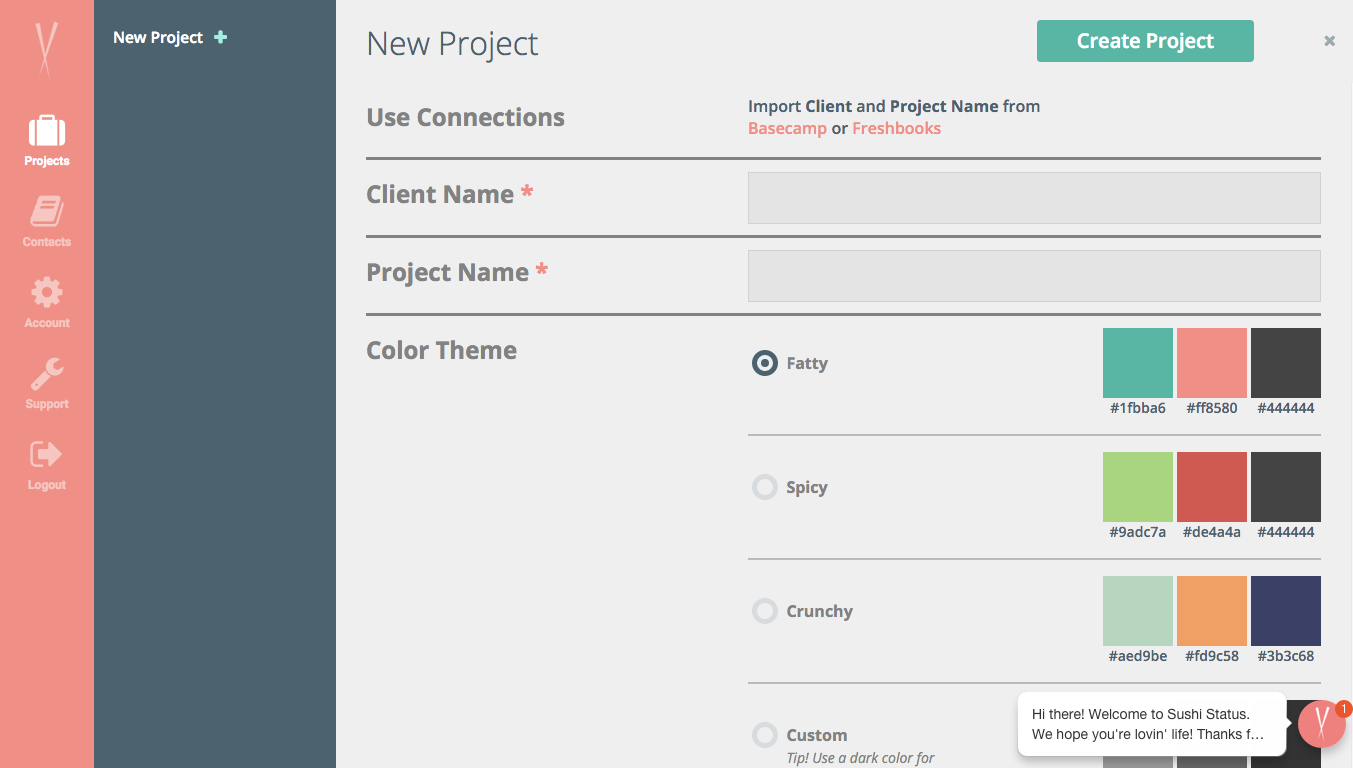
Sushi Status solves this problem with streamlined, easily comprehensible reports. In other words, you can make reports people will want to read.
To compose a new report, just drag and drop the elements for your report (text block, timeline, checklists) into the order you’d like. Choose a color scheme, add a logo, and even pull in data from Basecamp or FreshBooks. Then, select your recipients and send it off.
Sushi Status Price: Free for first project, $29.99/month for 10 projects
Piktochart
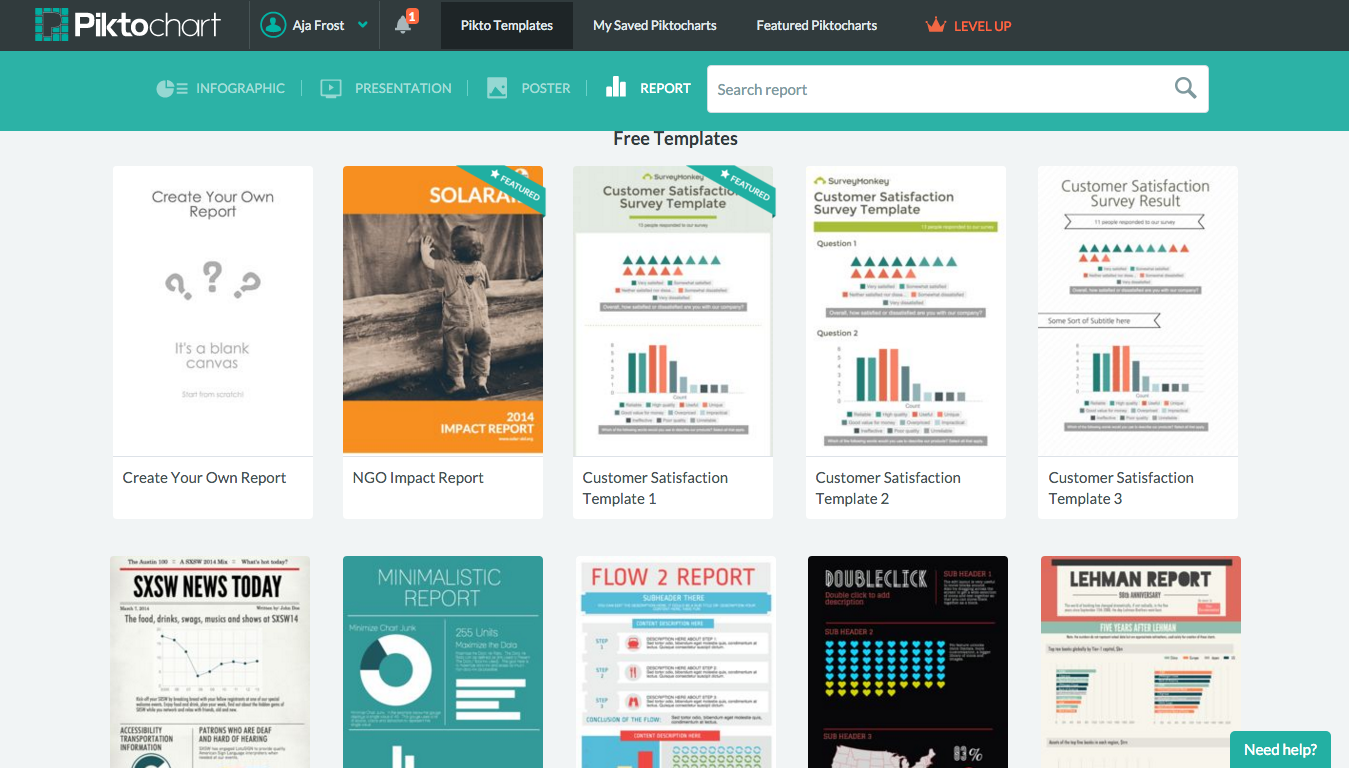
Although primarily known as a platform for designing infographics, Piktochart is also a fantastic tool for reports.
The free version gives you ten customizable templates. Although they each have different layouts and color schemes, every report is designed to print out onto two sheets of Letter-sized paper.
Piktochart gives you lots of freedom to play. Upload files; add text, maps, videos, and charts; change the color palette; incorporate graphics; even change the background.
Once you've got a design that works for this project, you can save it as a template—which means generating a new version for a different client will be a breeze.
Piktochart Price: Free; $15/month for advanced features
Sway
This new report app, from the Microsoft Office family, will make your clients think you have some serious design skills, even if you don’t know Photoshop from Photo Booth.
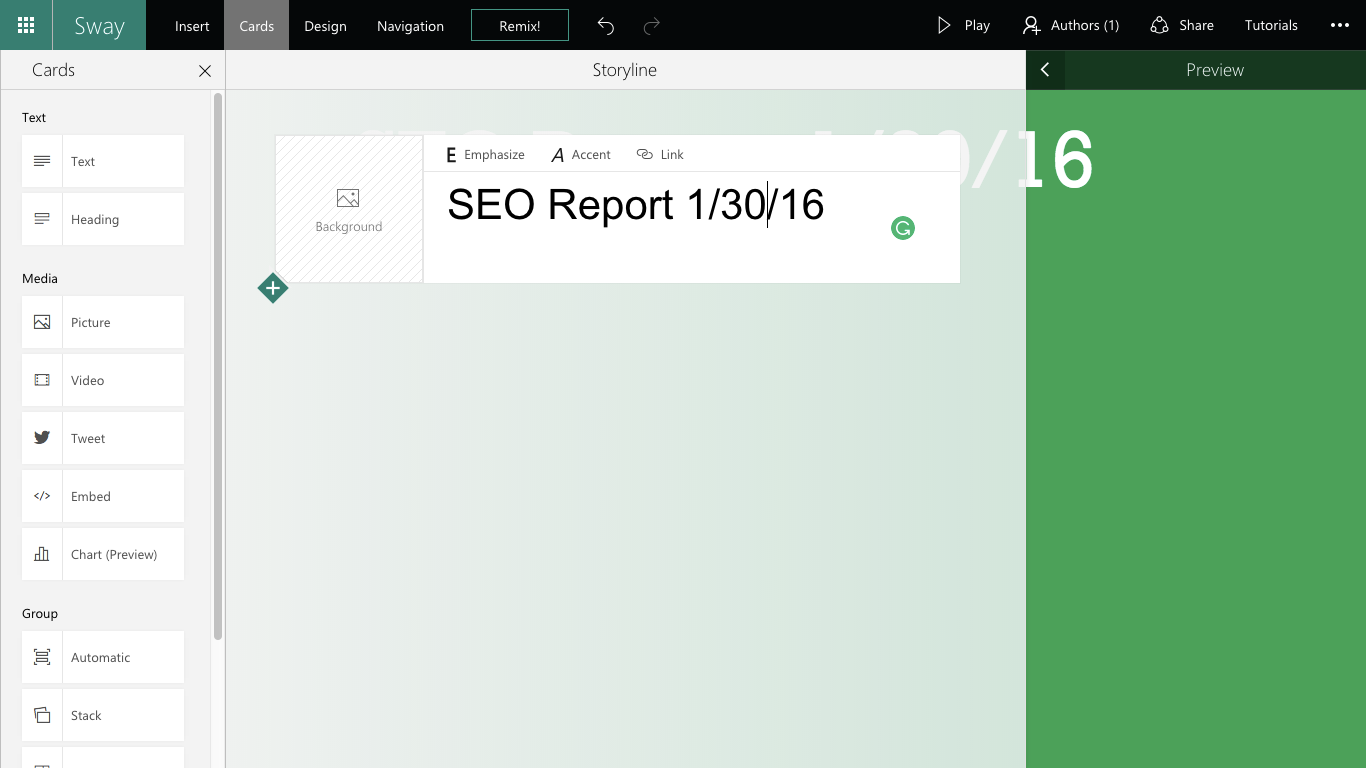
Sway allows you to make interactive reports, complete with charts, videos, web content, social media posts, and basically anything else you can think of. Plus, every report is responsive, so it’ll look great on your phone, laptop, tablet, or desktop.
The built-in design engine tries to come up with a design that fits your report automatically, but if you want a different theme, all you have to do is press "Remix" and it'll try again.
Sway Price: Free
Raven
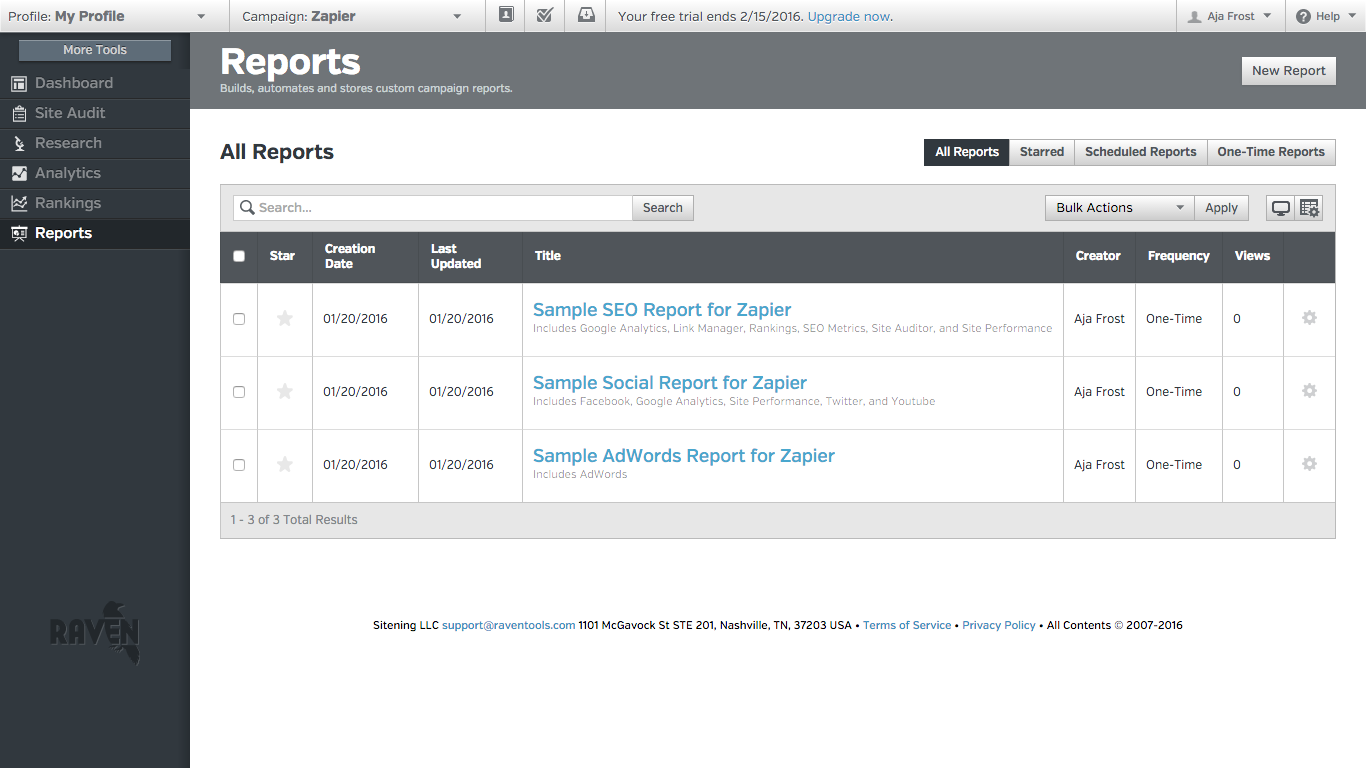
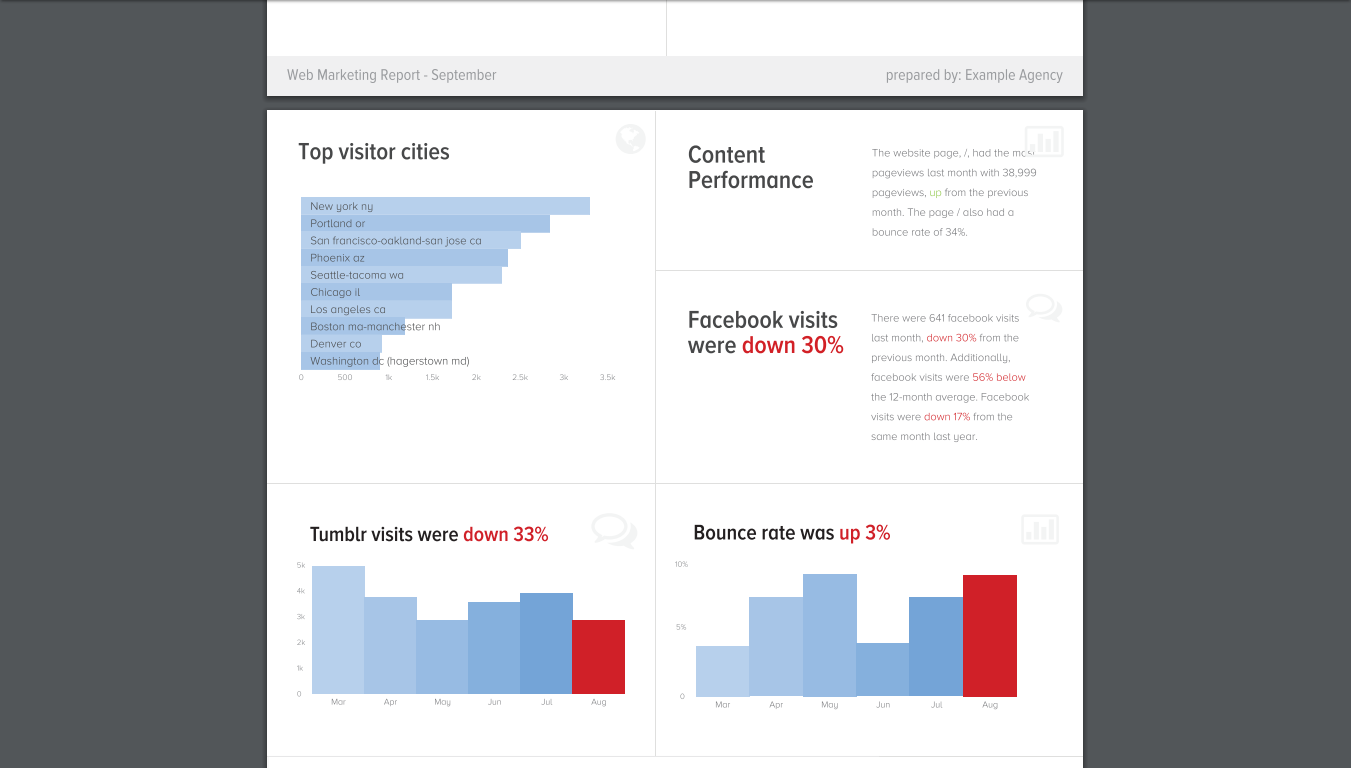
Working on improving a site's marketing? Raven's automated marketing reports will keep you focused on your marketing work, while still impressing clients with well-designed reports.
Here’s how easy the process is:
Land a new customer.
Log into Raven.
Add the customer, and customize the analytics they’ll get (including SEO, social media, and PPC Adwords data)
Schedule the reports—from daily to quarterly
With the reporting out of the way, you can focus on what really matters: the results.
Raven Price: $99/month for 4 users; $249/month for unlimited users
Use Raven Tools integrations on Zapier like these to automatically add keywords to Raven from forms, calls and more:
Zoho Analytics
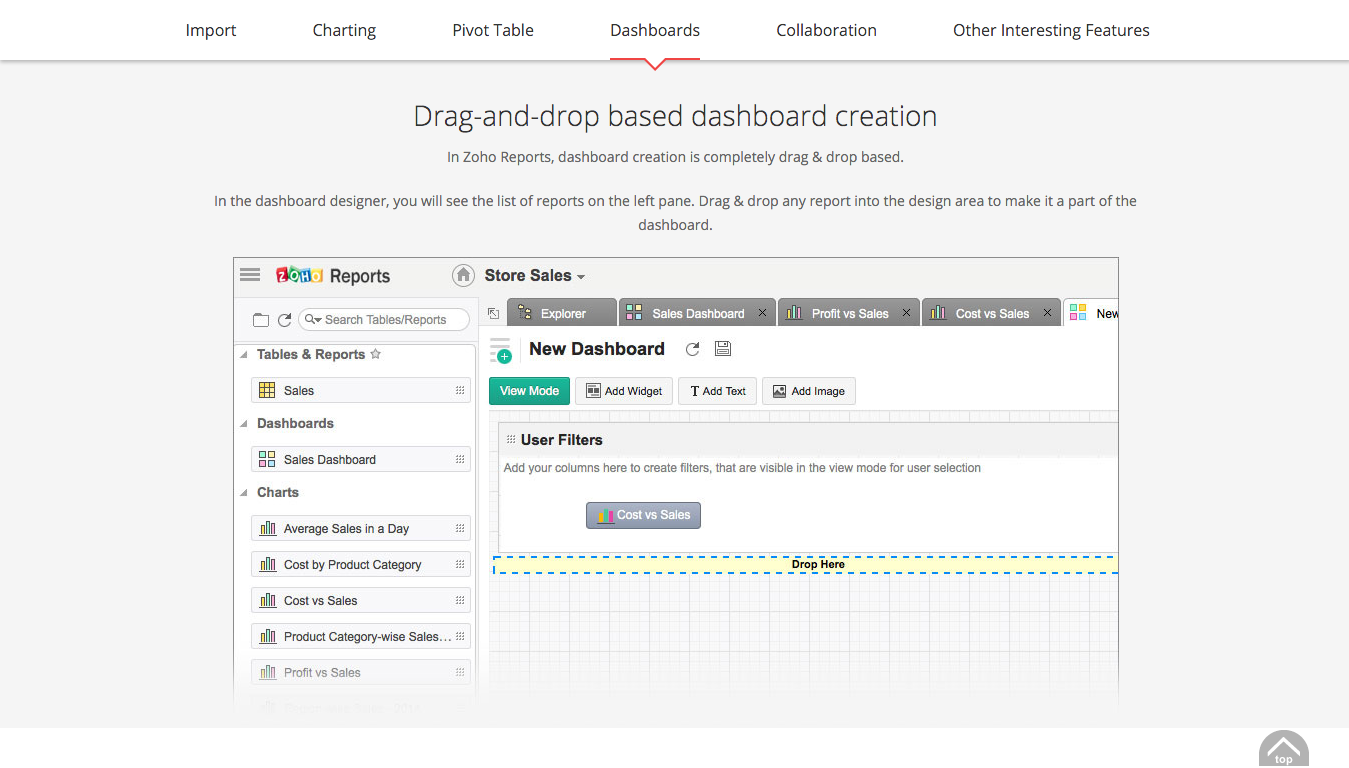
Want to create a free-form report? Zoho Analytics is a tool that'll work for everyone.
It gives you a ton of freedom to create reports about anything. Import data from any source (including hosted and in-house business applications) and easily create a visual summary, using charts, pivot tables, and Excel-like data representations. The collaboration feature is also a nice extra, as it makes developing reports with a coworker easy—something most design tools don't include.
Zoho Analytics Price: Free for 2 users; from $50/month for 5 users
Automate Zoho Analytics with Zoho Analytics' Zapier Integrations.
Editor's note: Zoho Analytics was formerly called Zoho Reports.
SmartDraw
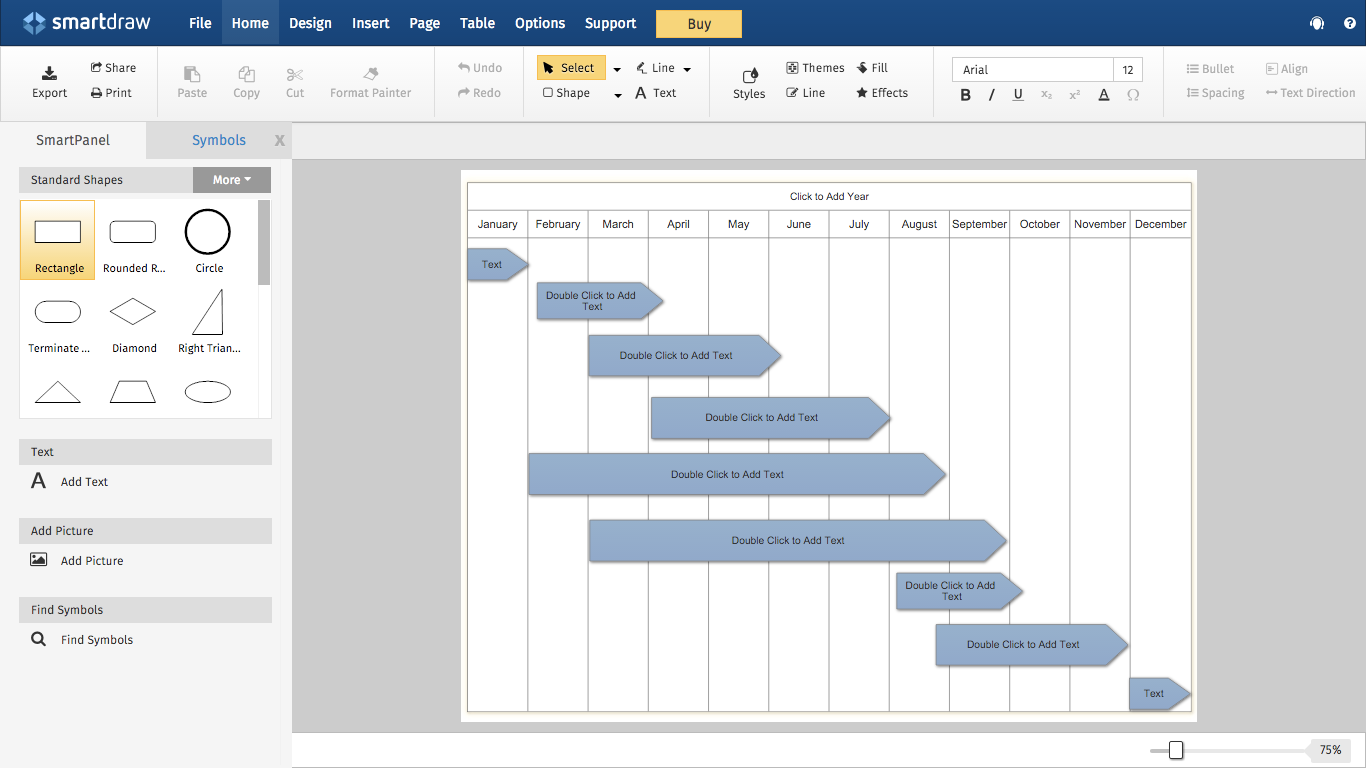
SmartDraw is a fantastic resource for creating professional-looking diagrams, charts, and timelines. It’s a visual processor—the world’s first, in fact.
Just like a word processor automatically applies a format to your text, SmartDraw automatically applies a format to your data visualizations. It comes with hundreds of templates and examples to get you started.
Plus, it integrates with the Microsoft Office suite. Let’s say you’re working on a report in Word; once you create a drawing, putting it in your report takes just one click.
SmartDraw Price: $99 for cloud-based version; $197 for Windows version; $497 for Enterprise edition
LucidChart
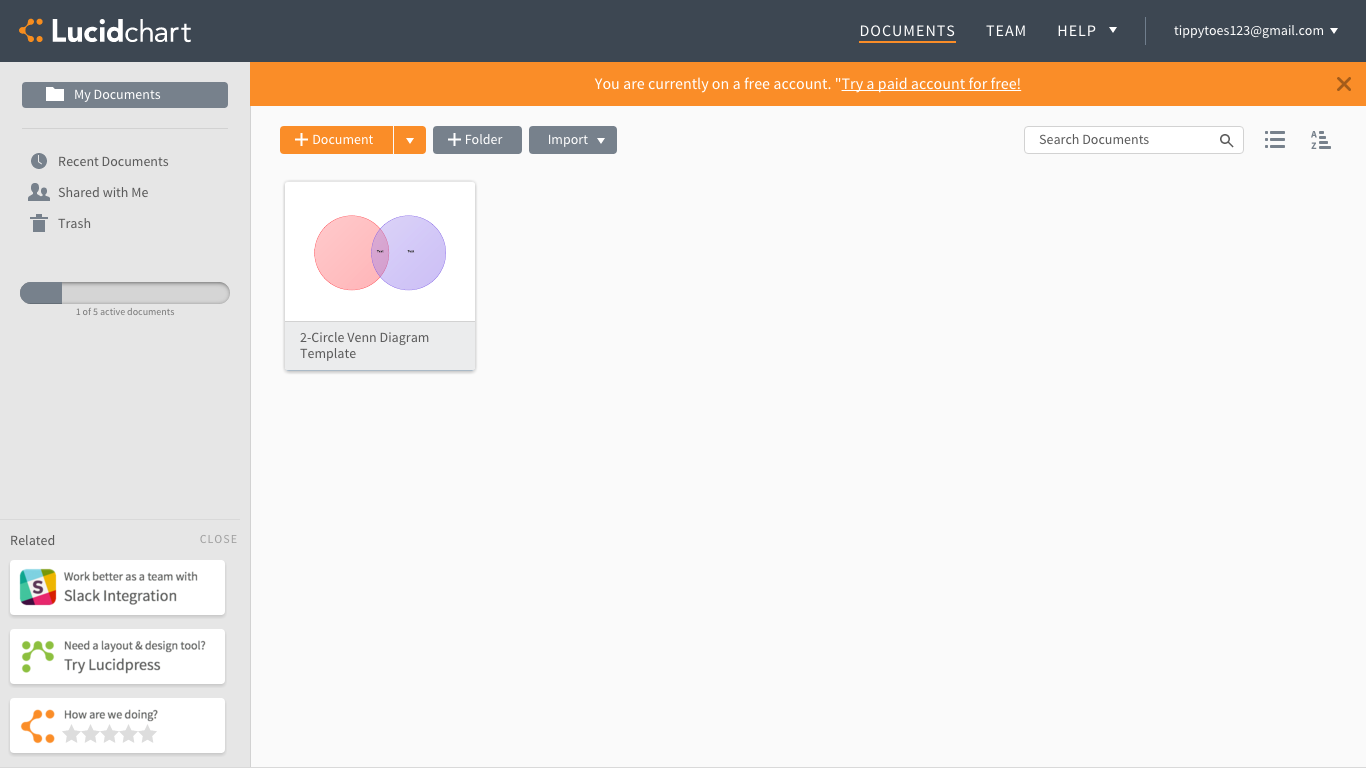
SmartDraw isn’t your only option, when it comes to quick designs. LucidChart, a diagramming tool, also gives a variety of design options for diagrams.
However, unlike SmartDraw, LucidChart is a web app, one designed for teams. You can share your work with others, comment about what needs changes, and revert to old versions of yoru designs if you need.
LucidChart reports are embeddable, so you can effortlessly drop them into a wiki, website, or blog. When you edit a report on the LucidChart site, your changes will instantly show up on the embedded version.
LucidChart Price: $4.95 for basic, single-user account; Team accounts from $20/month for 5 users
Automate LucidChart with LucidChart's Zapier Integrations.
Measureful
Wondering how your ads are performing? Measureful is an app to turn that data into a report. It connects with your ad accounts, including Google Analytics, Facebook, and Google Adwords, to bring all your marketing efforts together.
After pulling all your data together, Measureful performs its own analysis. You can then choose the metrics that are shown, select a design, then upload your logo and add any additional commentary you want in the report. The finished product is a beautiful PDF with your own logo and branding.
Measureful Price: $49/month for 10 reports; $99/month for 50 reports; $249/month for 150 reports
Formstack Documents
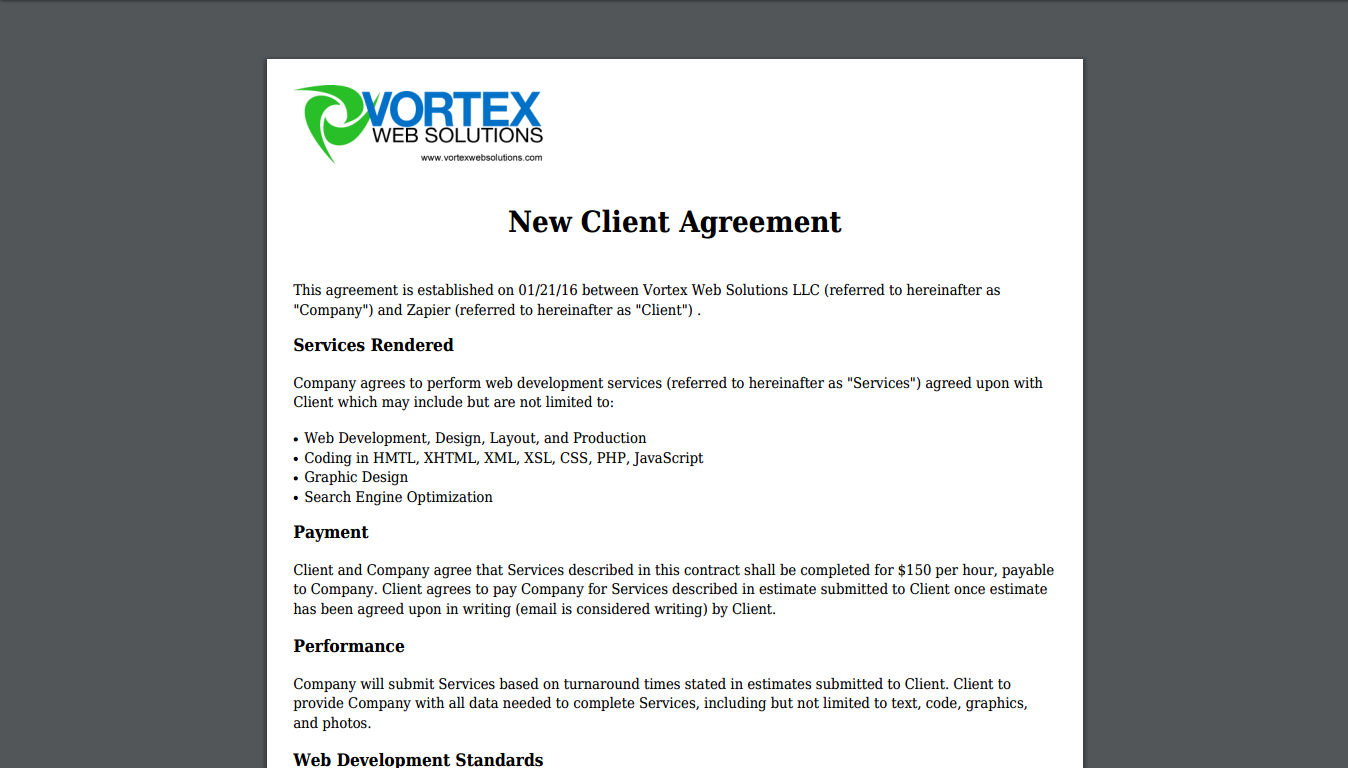
One of the simplest ways to make a report is to drop numbers and graphics into a Word document, but even that can take time out of your day. Formstack Documents can handle it for you instead. Add your document templates to Formstack Documents, then send in data from your apps, and Formstack Documents can turn it into completed documents automatically.
You can even set up complex delivery features. Let’s say you offer five services, and you need to send a different version of your contract depending on which service the customer is buying. Formstack Documents will automatically send the correct one. Or maybe you only want to send a client brief to one sales rep, not all 10. That’s easy to do.
Formstack Documents Price: From $29/month for 30 documents per month
Use Formstack Documents' integrations on Zapier like these to create reports from forms, payments, sales and more:
Editor's note: Formstack Documents was formerly called WebMerge. Formstack acquired WedMerge in April 2019. Learn more about the acquisition and any changes to the product from Formstack Documents.
Internal Reports for Your Team
Your internal meetings may need some graphics and charts as well, but what about the data that's reported outside of meetings? Perhaps you need to know what your team's working on without bugging them for status reports every day, or just want a quick way to see your company's sales this month. These tools will help.
Status Panda
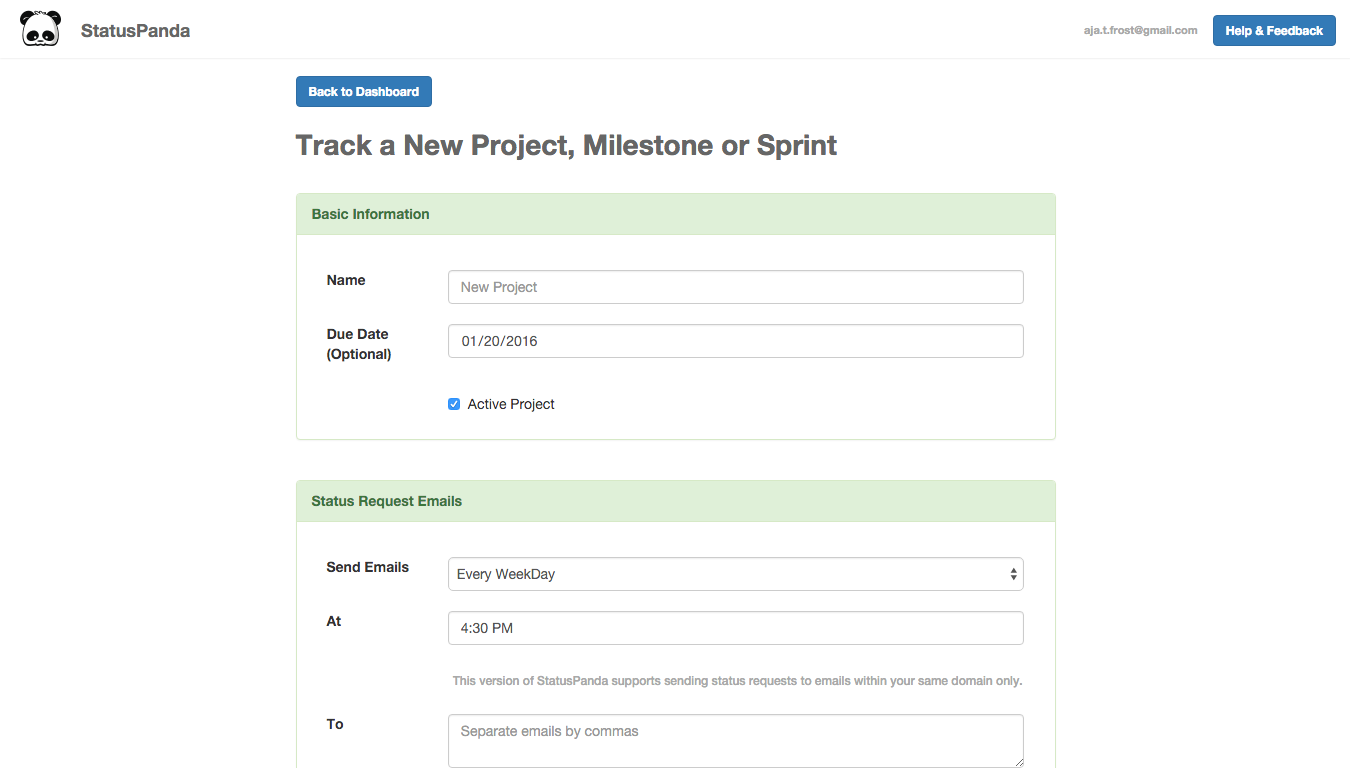
If you’re tired of bugging your team members for updates, Status Panda could be the app for you.
Say you’re currently managing four projects. You can set different check-in times and frequencies for each member of each project; maybe you need an update from Chris every morning, but one update per week from Jen is totally fine.
Status Panda will email your team members, get their updates, then sends you back a summary report. Since it works over email, there’s no onboarding required—and your coworkers will never have to leave their inbox.
Status Panda Price: Free
Report HD
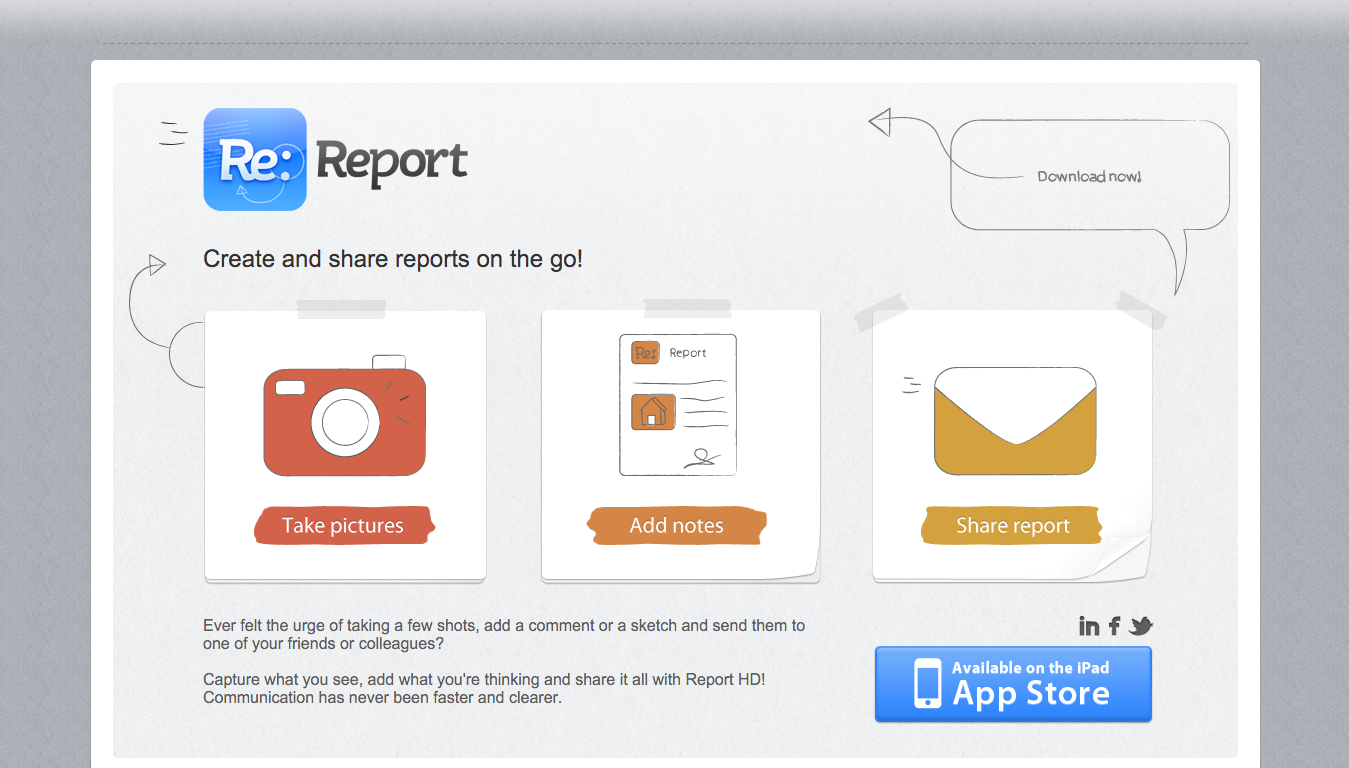
For on-the-go visual reports, use Report HD. Just open the app, take a picture, then overlay it with notes or sketches.
Then, add your logo and set a footer to turn the image into a report. Upload it to Dropbox or Evernote so you can reference it later, or email it directly to your teammates. It's not as professional looking and polished as the visual report apps above, but it's a quick and easy way to add a bit more detail to graphics.
Report HD Price: Free
Weekdone
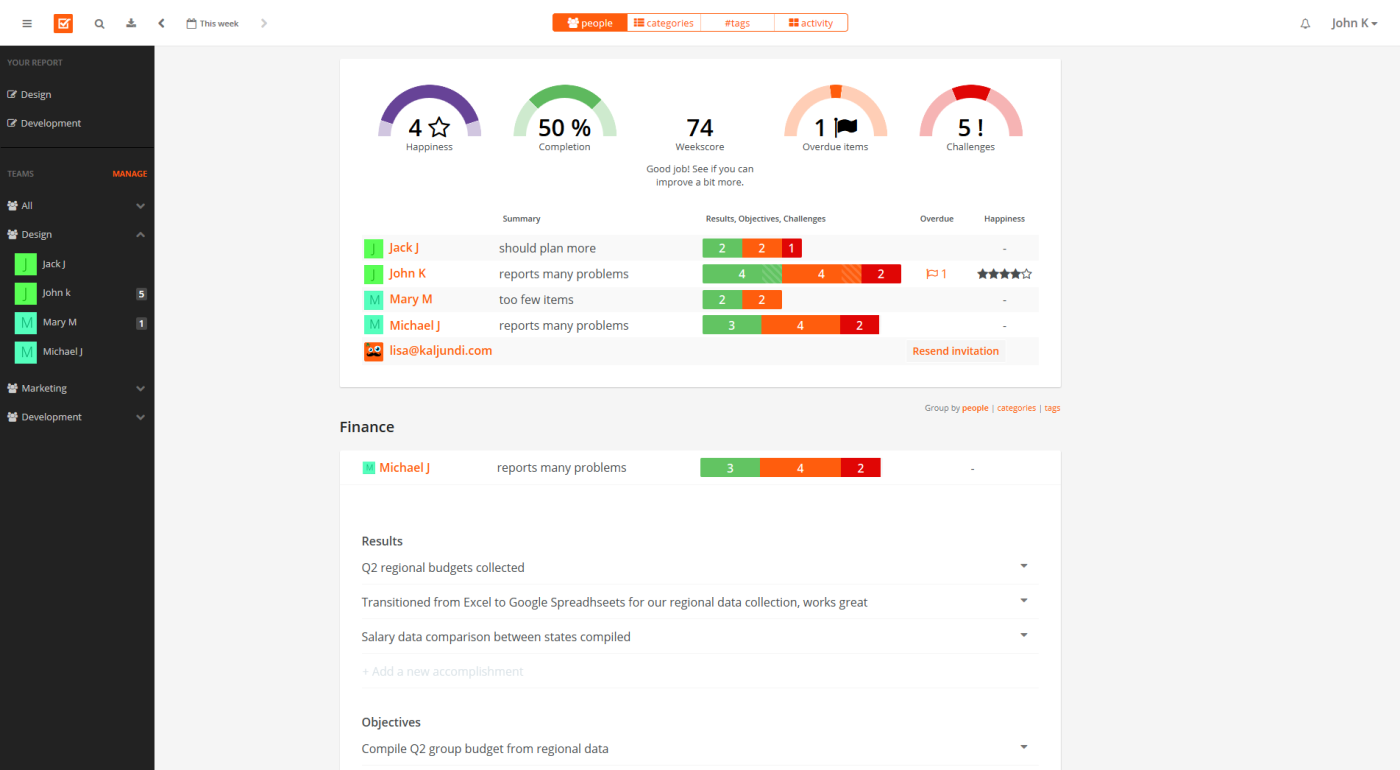
Need reports faster? Weekdone turns your team's status updates into daily newsfeed or a weekly email report—your choice. The summary gives you a quick overview of what's been accomplished at the top, followed by more detailed feedback from each employee.
Weekdone follows the PPP model: plans, progress, and problems. Employees describe their objectives for the week (plans), their completed tasks (progress), and their delays or issues (problems).
Everyone can interact within the report, so if an employee is struggling with a particular assignment, coworkers can comment with suggestions.
The Weekscore feature is also really helpful for managers. It uses employees’ responses to calculate how "healthy" your team is; this will alert you to dips in morale and show you the trends in your team’s success over time.
Weekdone Price: Free for up to 3 users; from $49/month for up to 10 users
Use Weekdone integrations on Zapier to log events, published blog posts, tasks and more to your Weekdone report:
More details
More details
Sprintboards
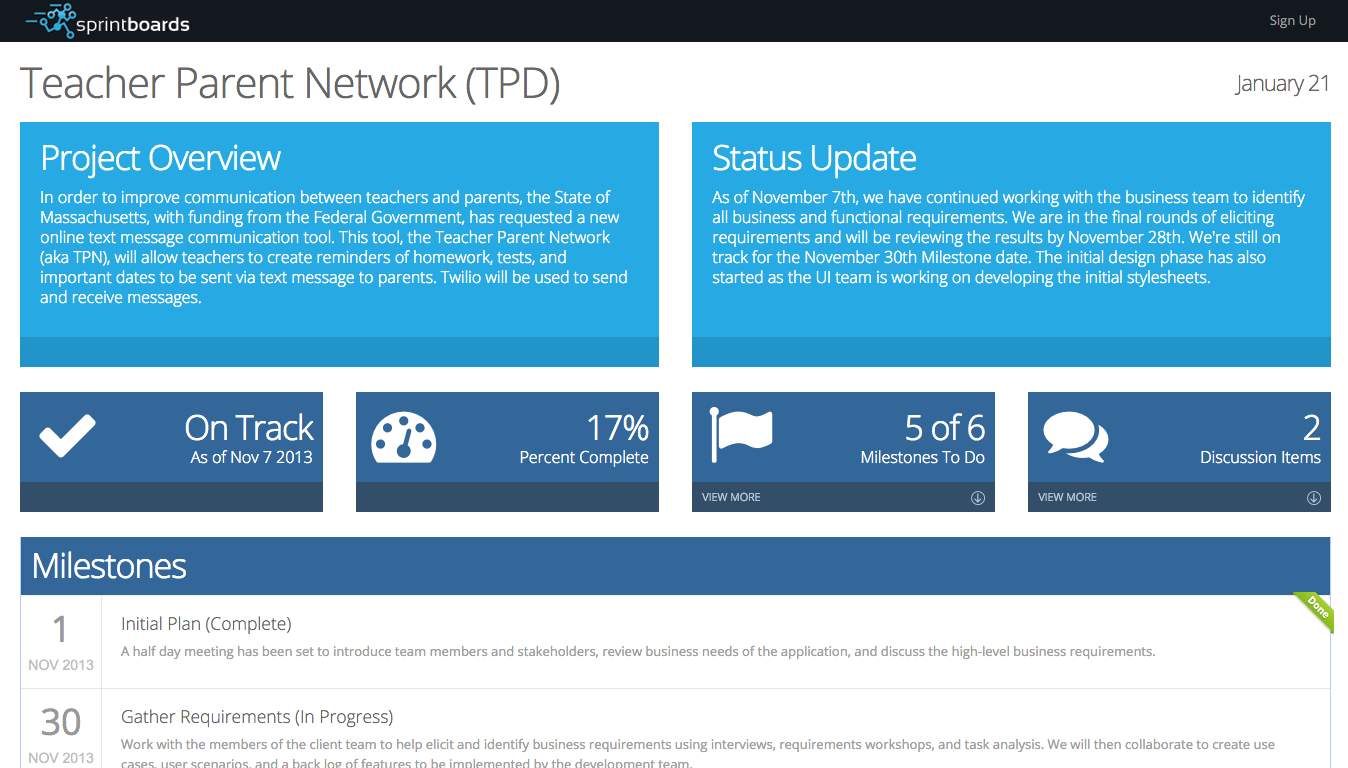
Asana is a great tool for managing your team's tasks, and Sprintboards can turn those tasks into a report in just a minute.
You can then save a one-page report about any of your Asana projects, perhaps to let your client know how your work on their site is coming along.
And you don’t have to worry about constantly making new boards. When you make changes to a project in Asana, just click "Update" on the corresponding Sprintboard, and it’ll reflect the most current version.
Sprintboards Price: Free in beta
I Done This
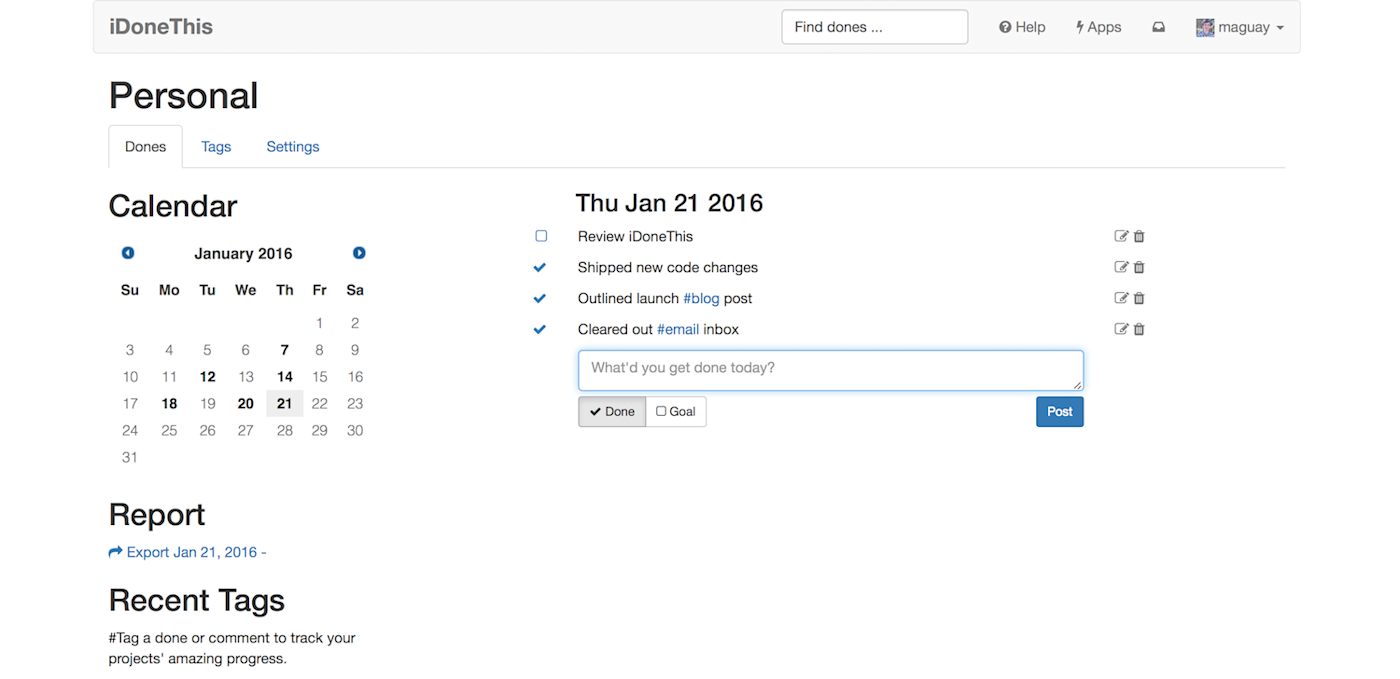
I Done This is an inverse to-do list: it focuses on what you've accomplished, not what's left to do. Each day, it will email asking what you've completed. The next morning, it'll send a followup email, showing what you and your teammates have gotten done.
The simple email will free up the time you would otherwise spend in weekly or daily status update meetings, while still keeping everyone in the know. And if someone's stuck—or has done an exceptional job—you can chime in with a comment from the I Done This web app.
I Done This Price: $9/month per user for Standard, $22/month per user for Plus
Automate I Done This with I Done This' Zapier Integrations, such as:
Editor's note: I Done This was formerly called iDoneThis.
HeyUpdate
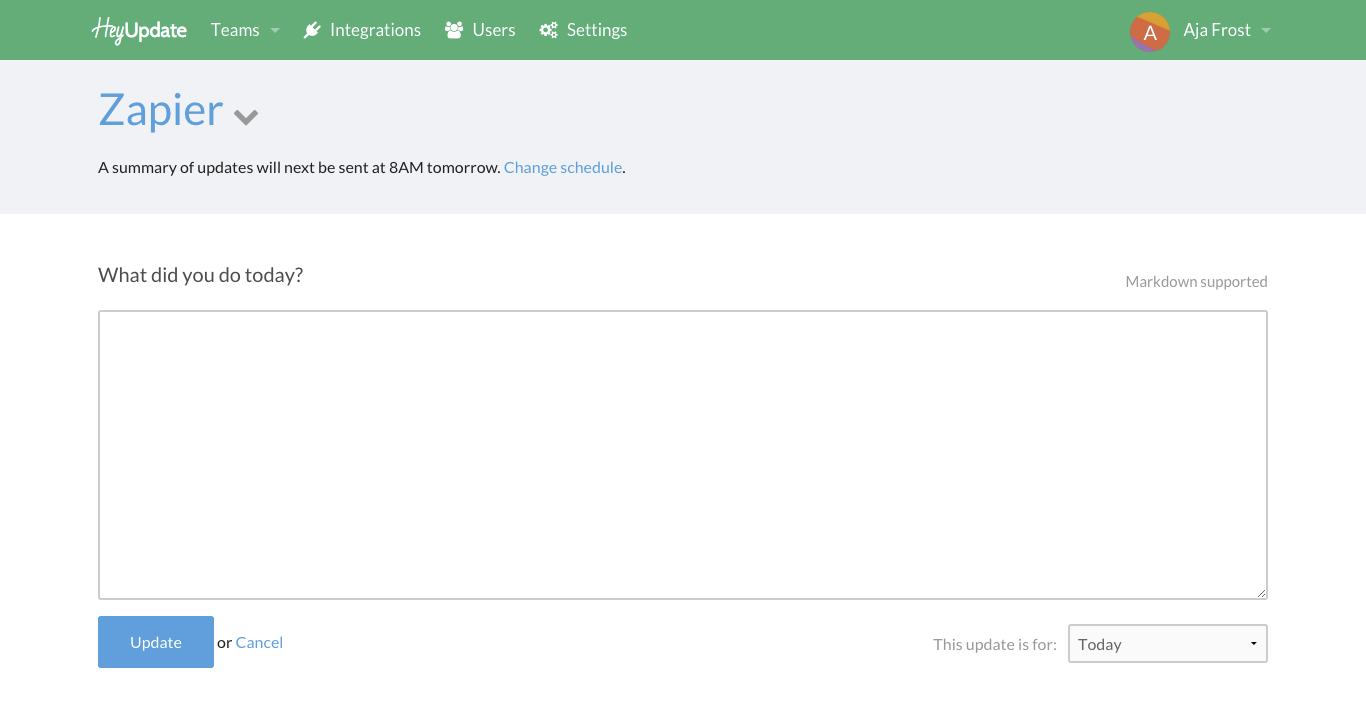
Another similar app is HeyUpdate, a progress reporting platform great for remote teams. Each team member answers a single question: "What did you do today?"
The next morning, HeyUpdate sends a summary of what the team accomplished by email or to your Slack channel. And "morning" doesn’t mean "morning for Joe, who lives in Boston, but night for Allie, who’s in Thailand." The app works with each person’s time zones, so updates are delivered at the right time across the world.
HeyUpdate Price: $5/month per user
Expensify
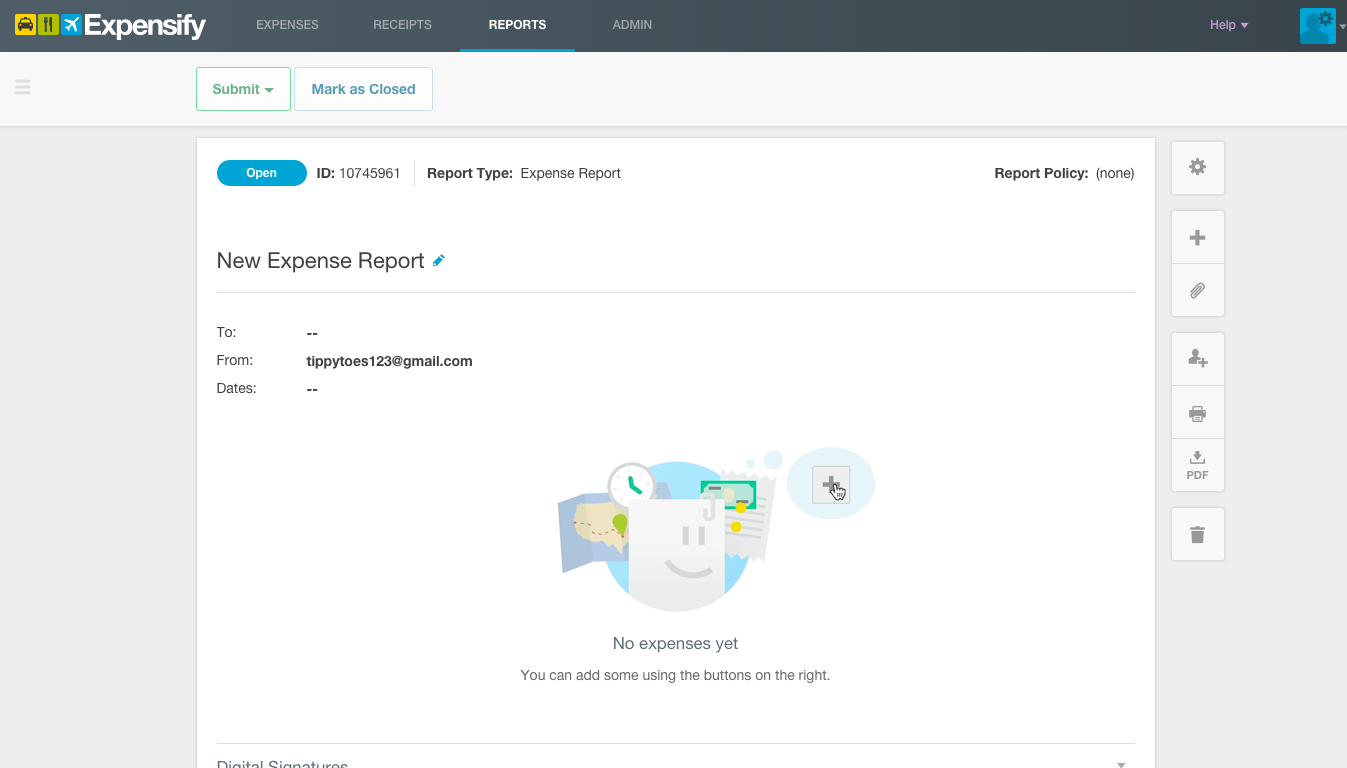
For more expense report features, Expensify is another great app that's even easier to use. Employees can link their personal and corporate credit cards for automated expense tracking. When they use cash, inputting those transactions is as easy as snapping a photo of the receipt.
Then, using your company’s accounting policies, Expensify auto-categorizes each expense, and turns them into reports. Admins can process hundreds of reports at once; centrally administer and reconcile all company card transactions, at any time; and reimburse team members via ACH Direct Deposit, PayPal or payroll.
Expensify Price: $5/month per user Basic plan; $9/month per user Corporate plan
Automate Expensify with Expensify's Zapier Integrations.
Geckoboard
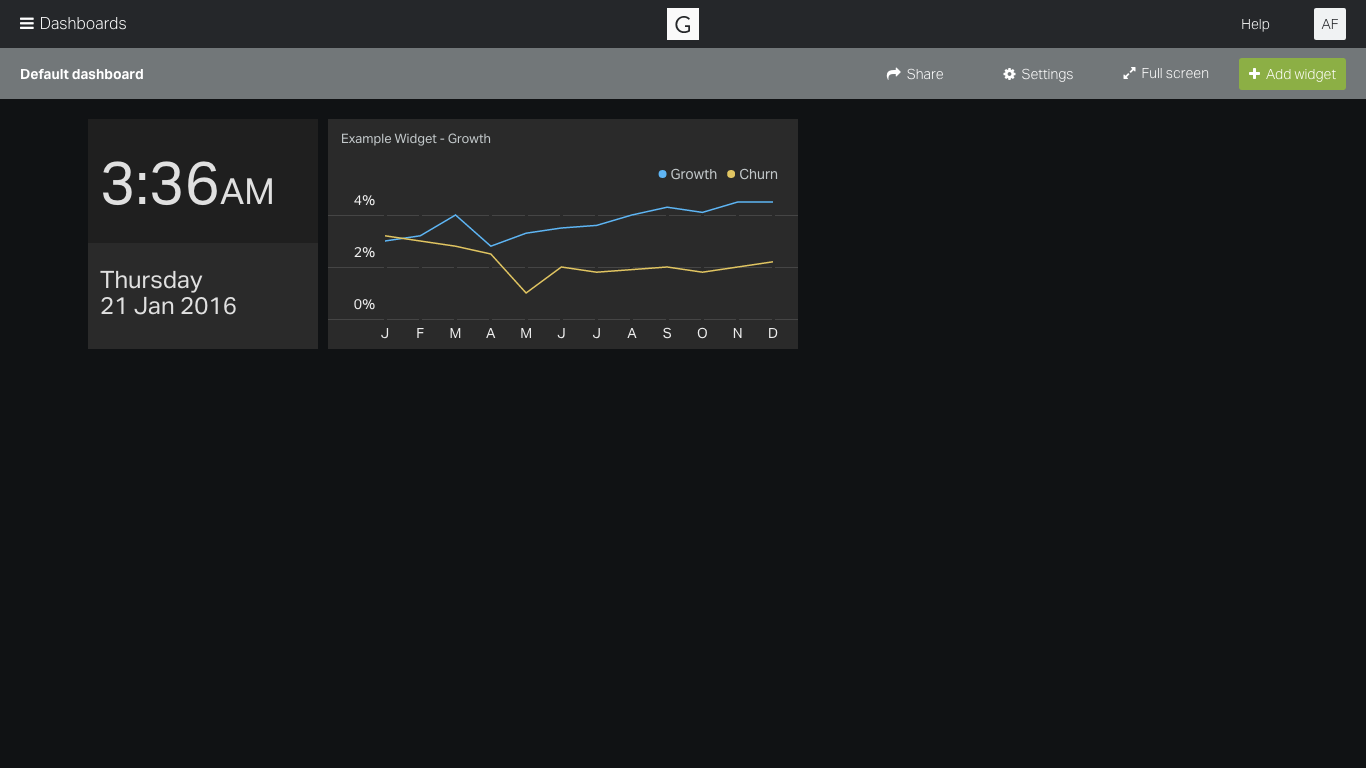
Whether you already have a data-driven culture or are trying to build one, Geckoboard’s beautiful dashboards and reports can be insanely useful. Connect it to your apps and data sources, choose the metrics you want to display, and you'll have a detailed dashboard to put on a TV in your office.
Whether you're tracking signups, sales, or your support queue, Geckoboard makes it easy to track the most important numbers for your business. You can even make extra dashboards to keep track of each department's important numbers and data on their own boards.
Geckoboard Price: From $49/month for 1 user and 2 dashboards
See Geckoboard integrations on Zapier
BrightGauge
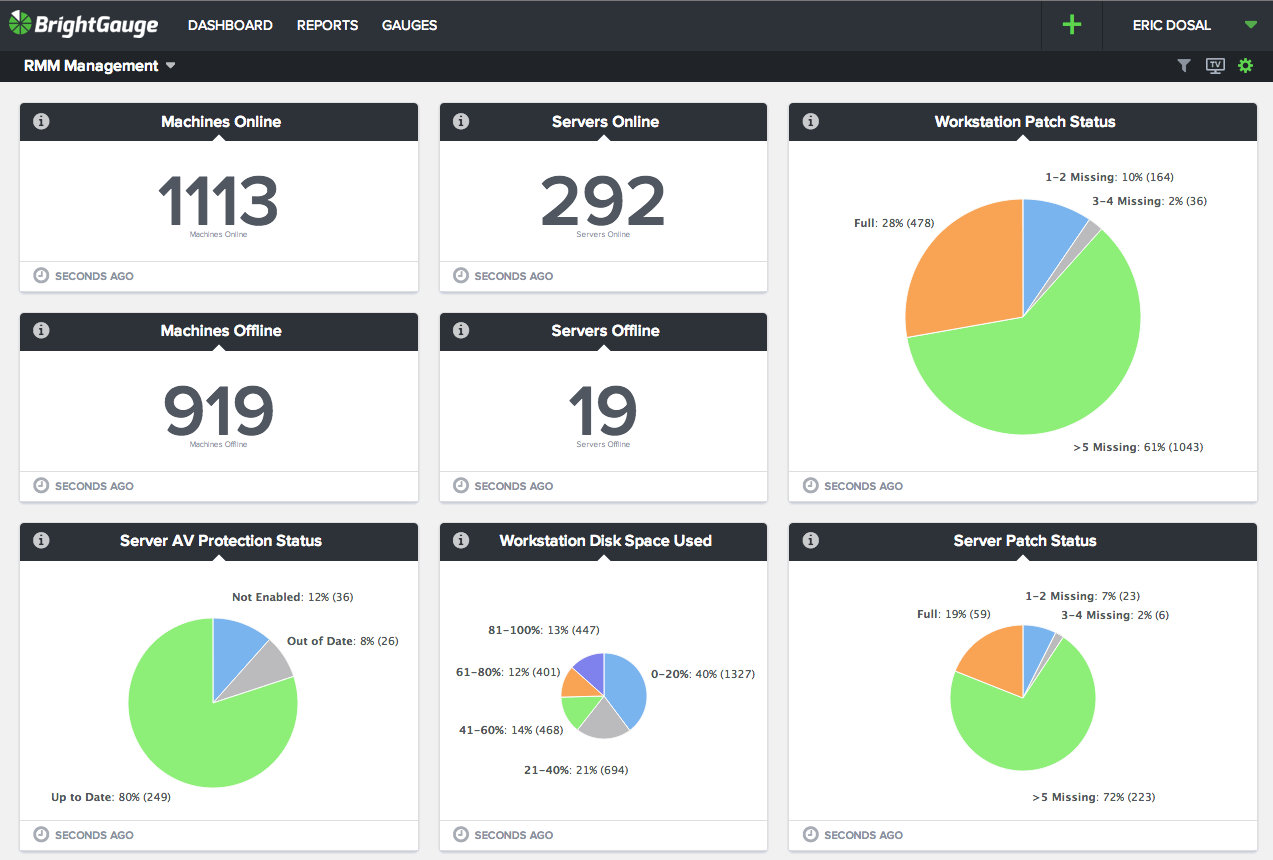
Still haven't found the reporting tool for your data? BrightGauge just might work, as it aggregates data from all your sources, including your CRM, help desk, network, security program, finance software, and project management tools.
Then, you can filter the data to find just what you want. Say you want your team members to see these six metrics in a dashboard, your client to see a different six in a PDF report, and your project manager to see all twenty metrics in a detailed report. BrightGuage can create them all from one app.
BrightGauge Price: From $199/month for 1 admin and 2 data sources
Individual Reports for Yourself
Reports aren't just great for tracking others—they're a perfect way to keep yourself motivated. Since you don’t have time to track everything and turn it into polished charts and graphs, these apps do it for you.
Retroospect
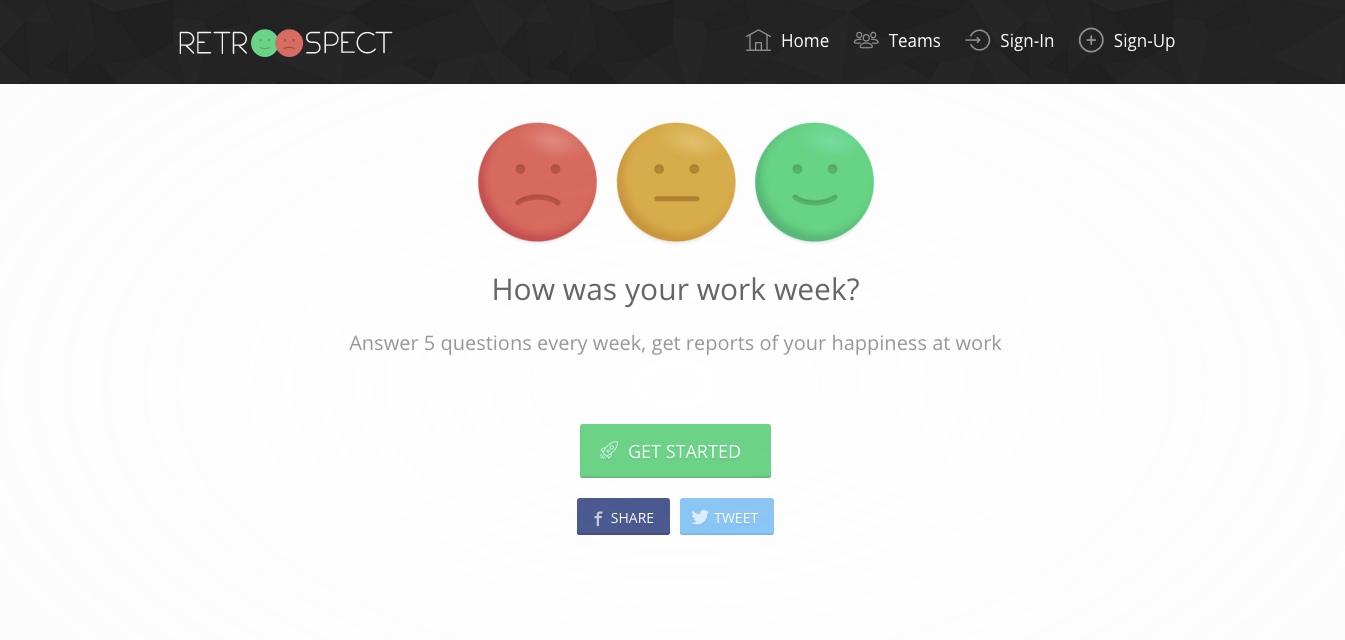
We tend to judge our weeks by how much we accomplished, but what if you've had a few bad days? Your mood can sharply change your productivity.
Retroospect puts the focus back where it belongs—that is, on your happiness. Each week, you answer five simple questions about your stress level, professional relationships, personal growth, etc. Retroospect tracks your responses, and helps you identify trends and areas for improvement.
Not only are the insights super applicable, but knowing you’ll be asked to reflect on your mental health will make you more mindful all week.
Price: Free for individual users; from $5/month for 5 users
Reporter
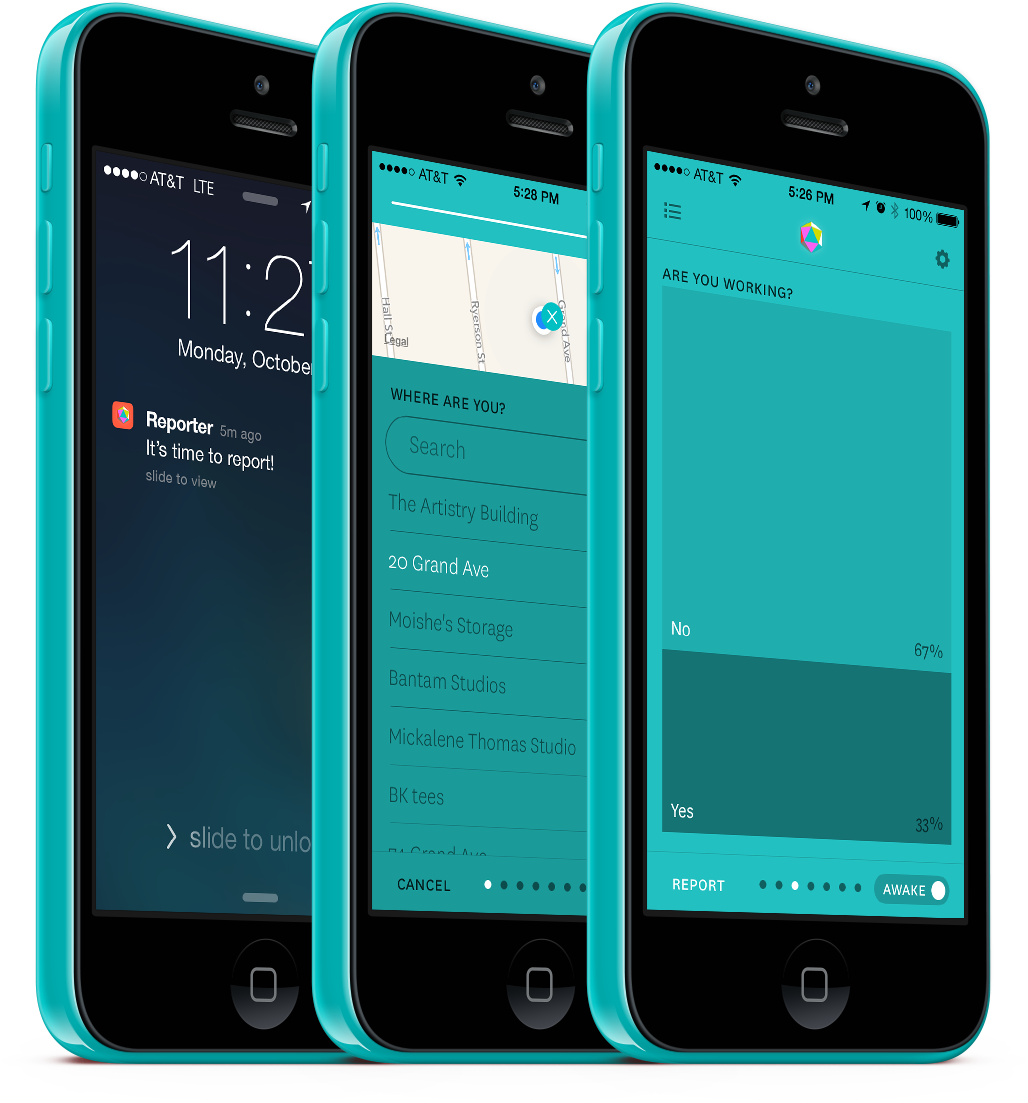
If you want more insight into why you feel what you do when you do, try Reporter. Two or three times a day, it’ll send you a short survey with questions like, "Who are you with?" and "What are you doing?" Thanks to the app’s autofill and smart suggestion feature, answering is a breeze.
Once you’ve given Reporter some data to work with, it’ll start revealing patterns and themes you may have never picked up on. To run your own analysis, just export the data as a CSV or JSON file—or even save it to Dropbox.
Reporter Price: $3.99
Gyroscope
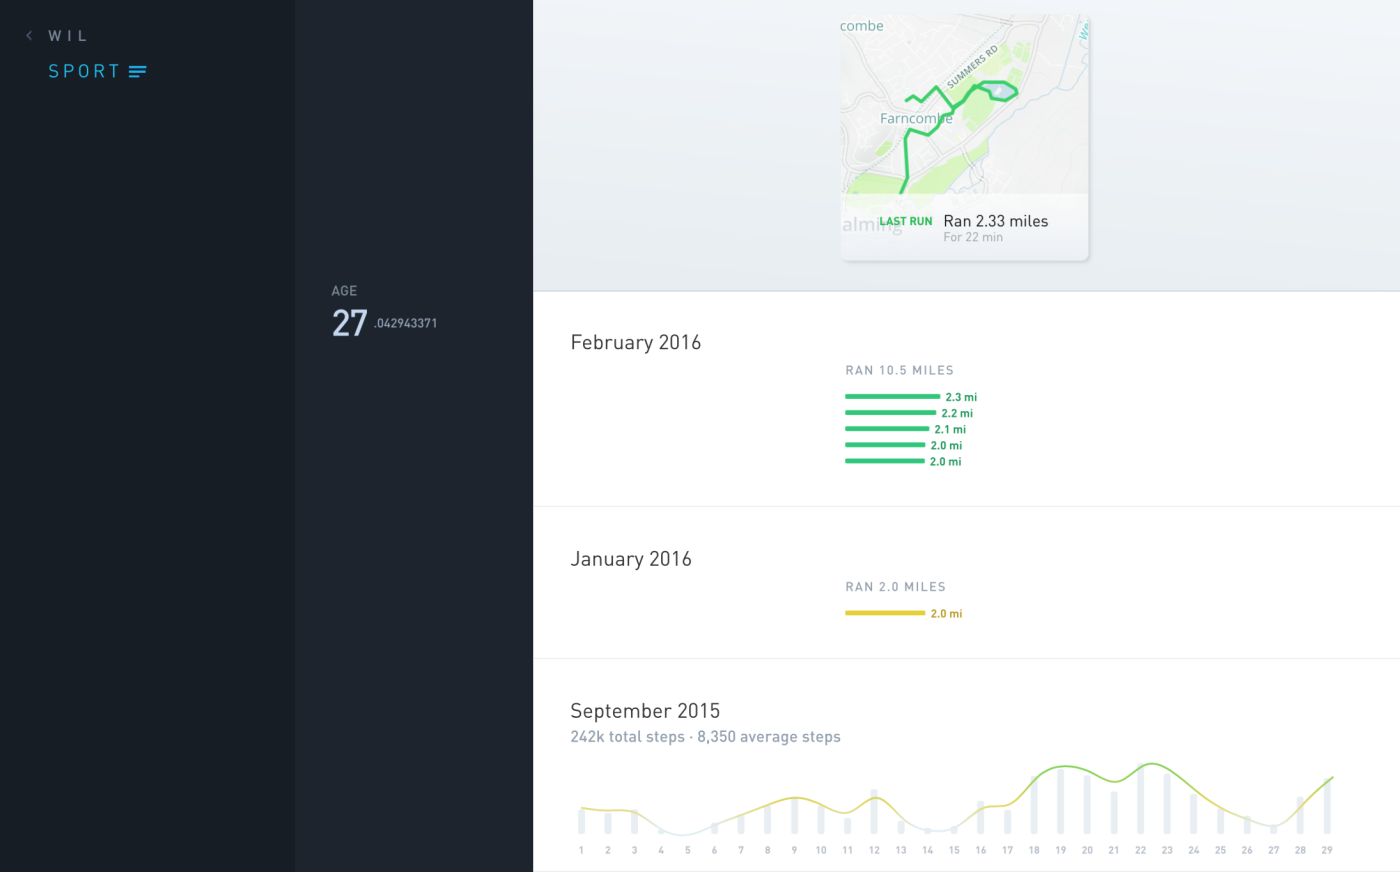
When it comes to your health, it’s frustratingly easy to get off track. However, Gyroscope will keep you in the game—both literally and figuratively.
The app pulls data about your activity and movement from the sensors and apps you’re probably already using: Instagram, Twitter, RunKeeper, Apple Health, Moves, Foursquare, Jawbone, and Fitbit.
Every Sunday, Gyroscope sends you a summary of your health, productivity, and top moments from the week.
Your info is automatically private. However, if you’d like some accountability, you can also add your friends or even turn your account into a public website.
Gyroscope Price: Free basic plan; $7/month for Pro
RescueTime
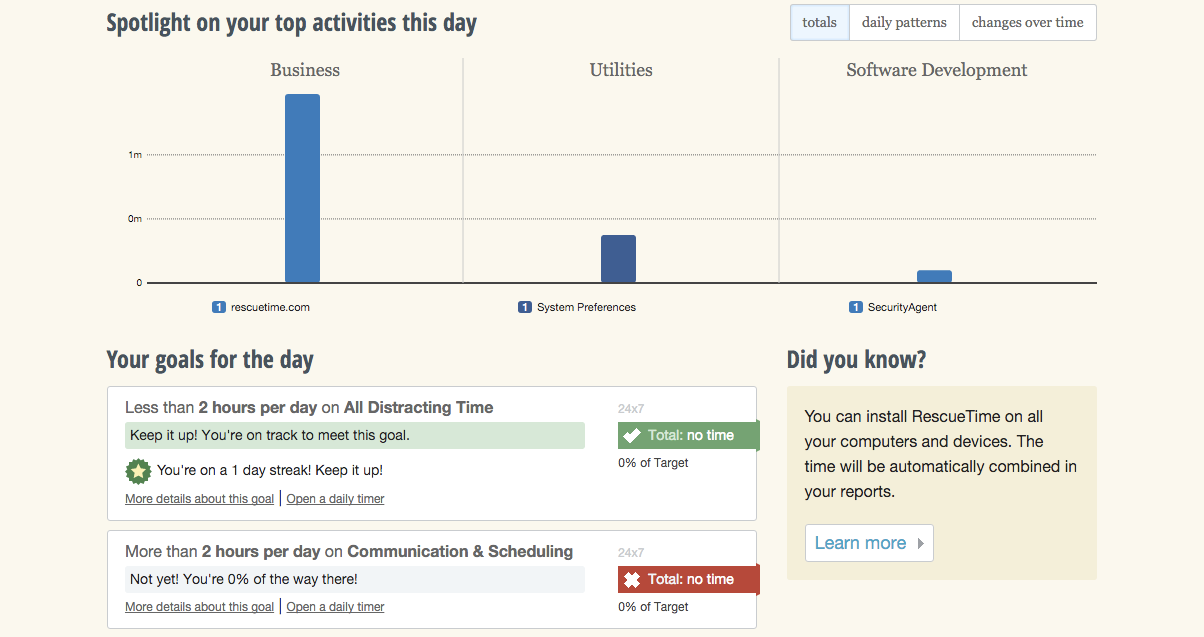
While most people think of RescueTime as a productivity tool, its core feature is reporting. This tool monitors how you’re spending your time on the computer: which applications you run and which websites you visit, for how long.
The resulting info is enormously helpful. You can, for example, see that you spent 30 minutes answering emails, 55 minutes writing code, and a whopping 45 minutes browsing Quora. For the websites (like Quora) that you realize are killing your workday, RescueTime has a handy "focus" feature that’ll let you block them for a given period of time.
Then, each weekend, RescueTime will let you know how productive you were this week in an email report.
RescueTime Price: Free for RescueTime Lite; $9/month for Premium
Use RescueTime integrations on Zapier to add emails, completed tasks, notes and more to your daily reports:
Moodprint
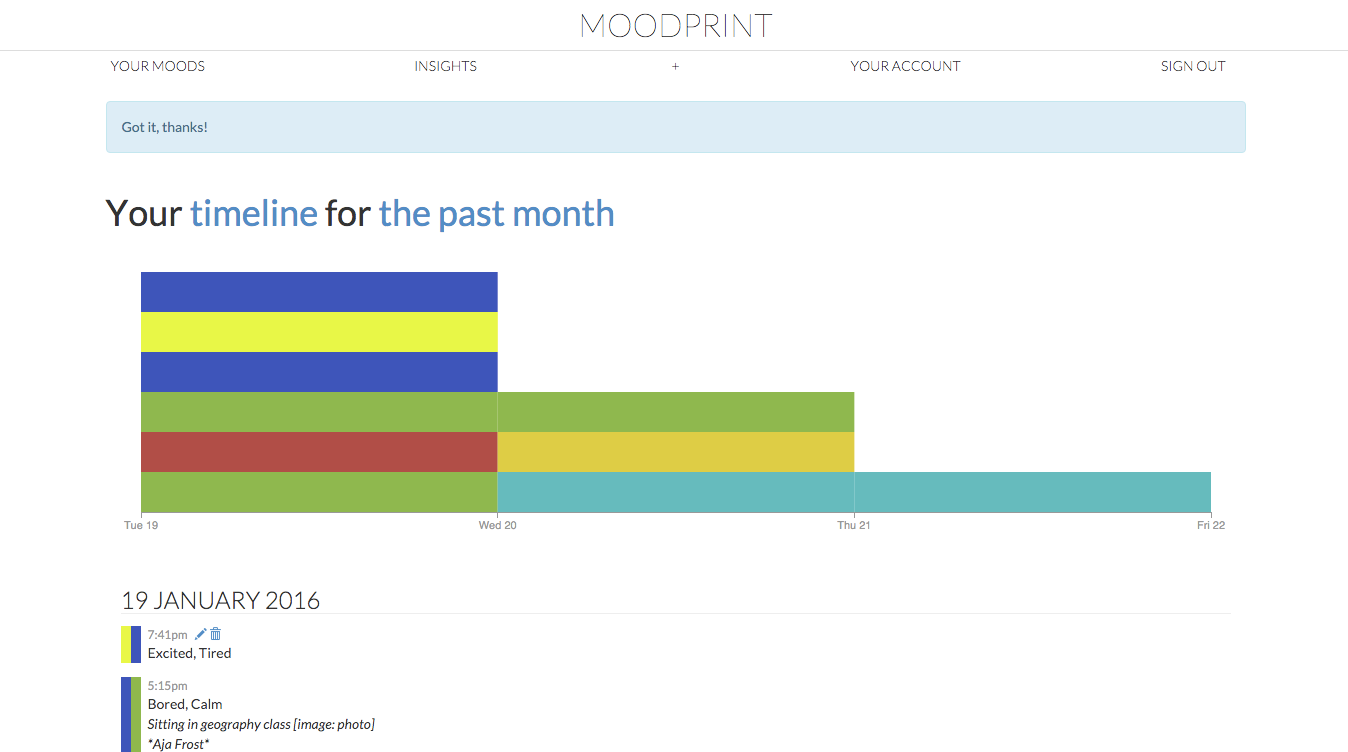
How often do you pause and think about the emotions you’re experiencing right that moment? Probably not enough. When you ramp up your self-awareness, you boost your ability to act rationally, not emotionally.
And that’s why Moodprint is such a useful tool. At random times throughout the day, it emails you asking, "How’s it going?"
You can respond with as many emotions as you want, even adding some context like, "Just learned project would be delayed."
The system will regularly categorize your moods, create a color chart to depict your emotional trends, and send the report to your inbox.
Moodprint Price: Free
WakaTime
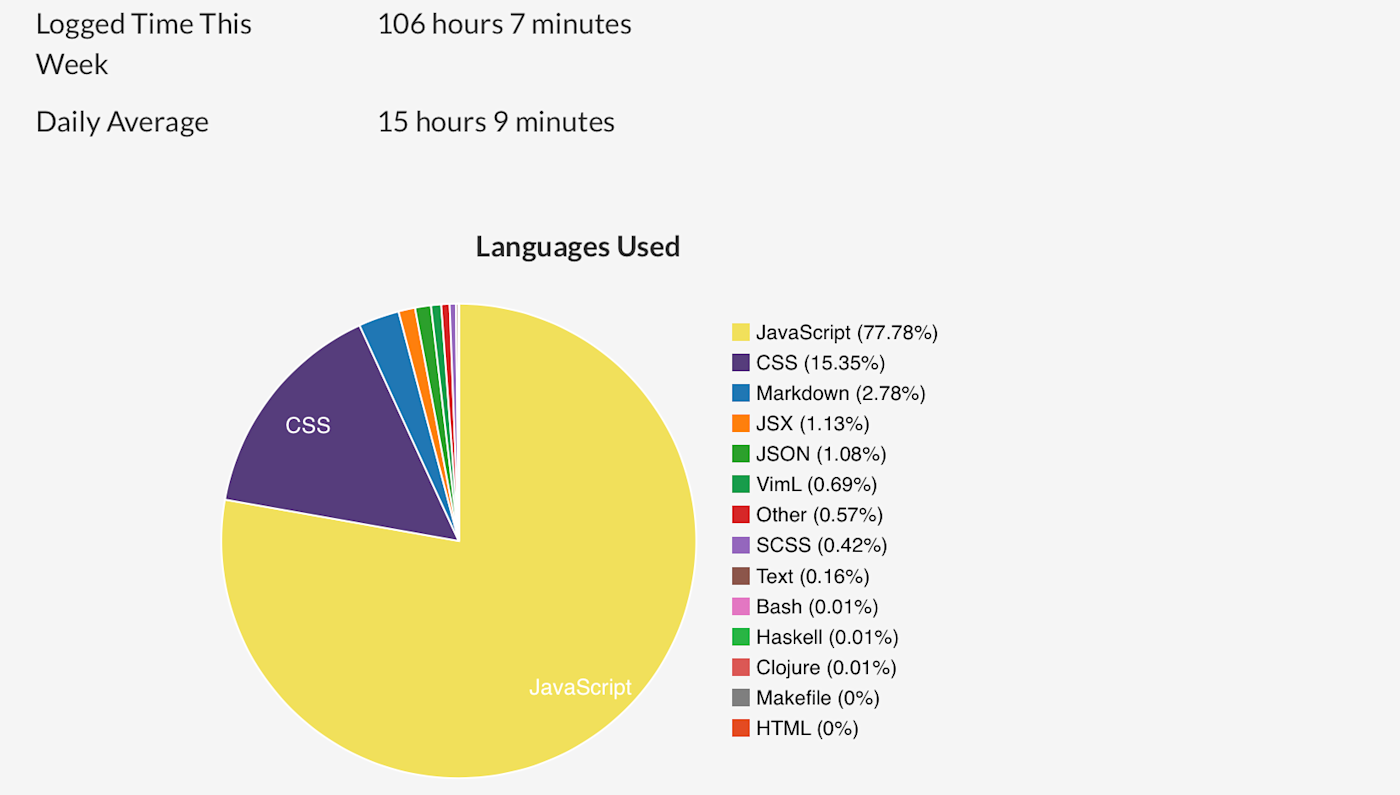
Software developers will really like this time-tracking tool. Once you install the open-source plugin, WakaTime will start measuring your progress. You’ll get real-time metrics per project, file, branch, commit, feature, operating system, and editor/IDE.
The language dashboard tells you how much time you spend coding in each language, while your productivity dashboard tells you how efficient you are.
Every day (or seven, if you’d prefer), the app sends you a summary of your activity.
And, fun bonus: WakaTime has productivity "leaderboards" so you can compete against other users. Whatever works to get you motivated, right?
WakaTime Price: Free; $9 per user/month for data exportation and unlimited history, $12 per user/month for team dashboard and project privacy settings
Take Your Reports to the Next Level
Now that you can create a beautiful report in minutes, it's time to start making reports on more things. Here are some ideas to get started:
Add exercise to your morning routine, then track your fitness project with a dashboard to stay motivated
Dive into your email reports and start tracking the right sales metrics
Managing a project? Once it's done, make reports for a postmortem to learn from your work.
Trying to figure out a better way to keep your remote coworkers informed of what you're doing? A visual report just might fit the bill.
The worst thing about reports is the time it takes to make them—but with these tools, that's no longer a problem. See how you can put some of these tools to work in your next reports, and let us know your favorite report generating tools in the comments below.
Turn your report into a presentation quickly—without tweaking an annoying PowerPoint template—with these 20 great presentation apps.
Updated in November 2019 to remove the following apps, which are no longer available: UpdateZen, 10at10to10, Cove, and Birdly for Slack.