Datadog gives you deep visibility into your infrastructure, applications, and logs, helping your team track system health and respond quickly when things go wrong. But not every important signal comes from your servers or cloud services. Incidents, asset changes, issue tracking, and even customer activity can all provide valuable context about the state of your systems and the work happening around them.
By using Zapier to automate how this data flows into Datadog, you can extend your monitoring to include operational and business signals without relying on custom scripts or manual updates. Scroll down for some inspiration on ways to automate Datadog today.
New to Zapier? It's workflow automation software that lets you focus on what matters. Combine user interfaces, data tables, and logic with thousands of apps to build and automate anything you can imagine. Sign up for free to use this app, and thousands more, with Zapier.
Table of contents
Enrich your monitoring with incident and alert activity
Monitoring infrastructure and application health is at the core of Datadog, but critical signals often come from outside those systems. Incidents declared in your on-call platform or alerts fired by external monitoring tools often represent the real moments when things go wrong. Logging this activity as custom metrics in Datadog helps bring that context directly into your dashboards and monitoring workflows.
For example, you can automatically post a new metric in Datadog whenever a check fails in Uptime.com, an incident is declared in incident.io, or a PagerDuty alert is triggered. These metrics make it easier to track incident volume over time, visualize where problems are happening, and correlate operational issues with your infrastructure data. You might notice, for instance, that spikes in API latency tend to align with periods of high alert activity, or that a particular service is responsible for most incidents.
Adding incident and alert data as custom metrics helps teams respond faster, understand root causes more clearly, and continuously improve how they handle issues across their stack.
Post new metrics in Datadog when new incidents occur in incident.io
incident.io + Datadog
More details
With this convenient workflow, immediately post a new metric in Datadog whenever there's a new incident recorded in incident.io. This provides an efficient way to stay updated on all new incidents as they occur, thereby facilitating prompt and effective resolution. Enhance your incident management process and keep your performance data up-to-date with this handy automation.
Post new metrics in Datadog for new or updated PagerDuty incidents
PagerDuty + Datadog
More details
Keep your monitoring dashboards connected with your incident response. This integration automatically posts a new metric to Datadog whenever an incident is created or updated in PagerDuty. By tracking incident metrics alongside your system data, you can quickly identify patterns between operational issues and infrastructure performance.
Get new Uptime.com check alerts as metrics in Datadog
Uptime.com + Formatter by Zapier + Datadog
More details
Push you're up and downtime alerts to Datadog Metrics and seamlessly integrate your monitoring data with your other databases, tools, and services. Assign your alerts priority levels within Datadog and receive alerts in real-time from one-minute checks.
Monitor IT activity alongside system metrics
Many operational issues start long before they show up in system metrics. New assets being added, service requests piling up, or tickets escalating in your IT management tools can all be early signals that something needs attention. By logging activity into Datadog from platforms like ManageEngine ServiceDesk Plus Cloud, Freshservice, and SolarWinds Service Desk, you can keep these events visible alongside your infrastructure and application monitoring.
For example, you could record a custom metric every time a new asset is registered in SolarWinds, or track the number of open tickets in Freshservice as they're created and updated. These metrics help your team monitor operational load and nip potential issues in the bud before they escalate.
Add metric posts in Datadog from new ServiceDesk Plus Cloud assets
ManageEngine ServiceDesk Plus Cloud + Datadog
More details
Create a Datadog metric post each time a new asset is added to ServiceDesk Plus Cloud.
Create new Datadog metrics for new Freshservice tickets
Freshservice + Datadog
More details
Stay on top of your IT support volume by tracking it where you monitor everything else. This automation posts a new metric to Datadog whenever a ticket is created in Freshservice. Now, you can visualize support ticket volume alongside your system performance metrics, helping you spot connections between infrastructure issues and user support needs.
Add metric posts in Datadog when Freshservice tickets are updated
Freshservice + Datadog
More details
Track the lifecycle of your IT support tickets in your monitoring platform. This automation posts a new metric to Datadog whenever a ticket is updated in Freshservice. By monitoring ticket update frequency and status changes alongside system metrics, you can better understand how infrastructure performance impacts ticket resolution times.
Post metrics to Datadog for new SolarWinds Service Desk assets
SolarWinds Service Desk + Datadog
More details
Keep track of IT asset growth alongside your system monitoring. This automation creates a new metric in Datadog whenever a new asset is added to SolarWinds Service Desk. By logging asset additions in your monitoring platform, you can better understand how infrastructure changes and growth correlate with system performance over time.
Create Datadog metrics for new SolarWinds Service Desk incidents
SolarWinds Service Desk + Datadog
More details
Bring your IT service incidents into your monitoring dashboards. This Zap automatically posts a new metric to Datadog whenever a new incident is created in SolarWinds Service Desk. With incidents visible alongside your infrastructure metrics, you can quickly identify patterns and connections between system performance and service disruptions.
Pro tip: Build an AI agent that helps you go beyond just counting tickets. An agent can analyze patterns—like repeat incidents, trending services, or escalations tied to specific systems—then flag potential root causes, helping your team catch issues sooner and respond more strategically. Read our guide to getting started with Zapier Agents.
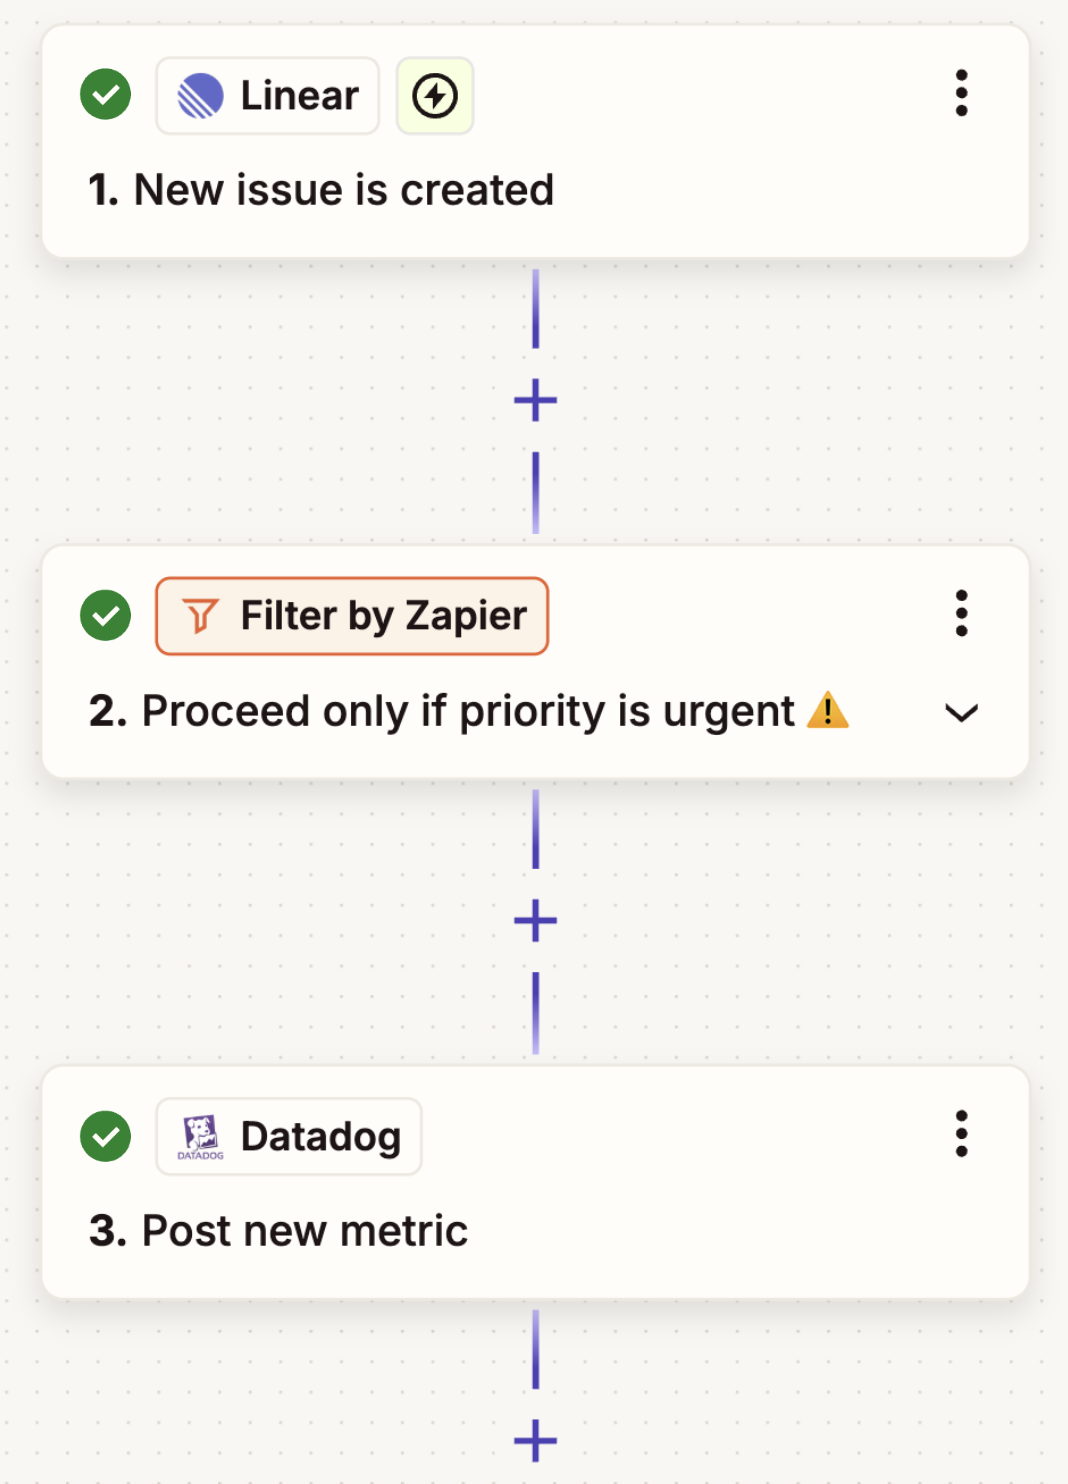
Surface issue tracking data in Datadog
While Datadog is primarily designed for monitoring infrastructure and applications, there may be situations where tracking activity from your project management tools can provide helpful context. Logging issue creation, bug reports, or task updates from platforms like Jira, Linear, or Asana as custom metrics could offer an additional signal when monitoring for risks or bottlenecks.
For example, you might log a custom metric in Datadog each time a bug is reported in Jira, a task is created in Xpertly, or an issue is updated in Linear. This approach may be especially useful in environments where frequent issue creation or escalations tend to align with system instability or deployment challenges. By surfacing these signals alongside your infrastructure metrics, you can help your team see factors that may be impacting your systems.
This use case won't apply to every team. But it is perfect for teams operating in high-change environments, or where engineering activity is closely tied to system health. In those cases, bringing project activity into your monitoring stack can help you identify emerging risks sooner and prioritize work more effectively.
Add metrics in Datadog for new Jira Software Cloud issues
Jira Software Cloud + Datadog
More details
Connect your development workflow with your infrastructure monitoring. This integration automatically posts a new metric to Datadog whenever an issue is created in Jira Software Cloud. By tracking issue creation rates alongside system metrics, engineering teams can better understand how system performance affects development activities and bug reports.
Send new Asana tasks to Datadog as metric posts
Asana + Datadog
More details
Monitor project task creation alongside your system performance metrics. This Zap automatically posts a new metric to Datadog whenever a new task is created in Asana. By tracking task creation rates in your monitoring dashboards, you can visualize how system performance correlates with team productivity and project management activities.
Pro tip: Only want to log critical issues? Add a filter step to send Datadog just the high-priority alerts. This helps keep your dashboards clear and focused on what matters most. Read our guide to using Filter by Zapier.
Track custom business or user activity metrics in Datadog
Business events like customer signups, payments, and form submissions can tell you just as much about the health of your systems as CPU usage or error rates. By logging these activities as custom metrics in Datadog, you can bring real-time business context into your monitoring workflows.
For example, you could add a custom metric every time a Stripe payment is processed, a deal is created in HubSpot, or an order comes through Shopify. You could also track survey submissions from Typeform or new entries added to Google Sheets or Notion.
This can be helpful for ops teams or SREs supporting revenue-critical systems, where keeping business signals close to system metrics helps surface issues faster—and keeps engineering efforts aligned with customer outcomes. If your team already uses Datadog dashboards to monitor key services, adding business activity metrics can offer a quick, real-time view of the events that matter most, without the need for a separate BI tool or complex data pipeline.
Post new metrics in Datadog from new or updated Google Sheets rows
Google Sheets + Datadog
More details
Keep your Datadog metrics up to date with this Google Sheets and Datadog automation. Whenever there's a new or updated row in your Google Sheets spreadsheet, this workflow will create a new metric post in Datadog, ensuring your data stays accurate and current. Save time and effort by streamlining your data management process with this seamless integration.
Create new Datadog metrics when new items are added to your Notion database
Notion + Datadog
More details
Track your performance metrics with ease by linking Notion and Datadog. With this workflow, whenever a new item is added to your Notion database, a new metric post will be created in Datadog. This seamless integration provides timely performance insights, optimizing your data tracking process for better decision making.
Create Datadog metrics from new Typeform entries
Typeform + Datadog
More details
Track user feedback and form submissions directly in your monitoring platform. This integration automatically posts a new metric to Datadog whenever someone submits a response to your Typeform. By visualizing form submission metrics alongside system performance data, you can better understand how your infrastructure affects user engagement and conversion rates.
Post metrics to Datadog for new Stripe charges
Stripe + Datadog
More details
Monitor revenue data alongside your system metrics. This Zap automatically posts a new metric to Datadog whenever a charge is processed in Stripe. By tracking payment activity in your monitoring platform, you can visualize how system performance impacts business outcomes and quickly identify when technical issues might be affecting your bottom line.
Create metric posts in Datadog from new HubSpot deals
HubSpot + Datadog
More details
Keep your sales pipeline activity visible alongside system performance. This integration automatically posts a new metric to Datadog whenever a new deal is created in HubSpot. By bringing sales data into your monitoring platform, you can better understand how technical performance affects revenue opportunities and customer acquisition.
Add Datadog metrics for new Shopify orders
Shopify + Datadog
More details
Visualize order volume alongside your technical metrics. This automation posts a new metric to Datadog whenever a new order is placed in your Shopify store. By monitoring order activity in your system dashboards, you can quickly identify when performance issues might be affecting sales and ensure your infrastructure scales with business demand.
Gain a more connected view across your stack
Your monitoring tools are most powerful when they reflect the full story of what's happening across your systems. By using Zapier to automate how business events, operational activity, and engineering workflows are captured in Datadog, you give your team the context they need to investigate issues quickly and stay focused on what matters.
And these workflows are just the start of what you can accomplish with Zapier and Datadog. What will you automate first?