I once viewed "process documentation" as corporate torture. My own system was a chaotic mix of muscle memory and flagged emails. And then I tried onboarding a new teammate while on holiday; my "clear" instructions unleashed a flood of confused Slack messages.
Back in the office, a whiteboard, marker, and a dose of humility led to my first crude visual workflow. It wasn't pretty, but it was a map, and infinitely better than fumbling directions from afar.
That's the entire premise of a visual workflow. It's not about bureaucracy; it's about clarity. It's about making the invisible visible so that work can happen without the constant questions, dropped balls, and frantic Slack messages. In this guide, I'll walk you through what I've learned—from what visual maps actually are, to practical examples you can steal, to the tools that help you create and automate them without it feeling like a chore.
Table of contents:
What is a visual workflow?
A visual workflow is a graphical representation of a process. We're talking diagrams, symbols, and lines that show the steps, the sequence they happen in, who's responsible, and any critical decision points. Think of it as the difference between someone telling you how you'll need to take four rights, a left, go down an alley with no lights, and then turn around three times and click your heels to find their apartment versus them just sending you a dropped pin on a map.
Most of us are visual creatures, and good workflow management is built on clarity. Trying to hold a complex, multi-stage process with various dependencies entirely in your head or decipher it from a dense document is like trying to assemble a 1,000-piece jigsaw puzzle in the dark. A visual workflow turns the lights on. It takes the jumbled, abstract concept of "how things get done around here" and transforms it into a tangible map, making it easier to spot where things are inevitably going wrong.

How is a visual workflow different from a normal workflow?
So, you've got workflows. Maybe they're enshrined in a 30-page document hidden away in the depths of a shared drive you can't even remember, or perhaps they exist as a series of folklore-like instructions passed down through generations of bewildered employees…
"Legend says, on a full moon, if you sacrifice a toner cartridge, the expense report gets approved..."
The point is that the "visual" part of a visual workflow is the fundamental shift that drags your processes out of the dark ages of assumption and into the slightly less murky present of shared understanding. Without that visual element, you're often just guessing, hoping, or endlessly clarifying.
Let's break down what this really means in practice, moving beyond just "it looks different" to "it works different."
Representation
Your typical "normal" workflow, if documented at all, often lives as dense paragraphs of text or a seemingly endless bulleted list. Visual workflows, on the other hand, use diagrams, standardized symbols, colors, and flow lines. These visual cues leverage how our brains are wired to quickly grasp spatial relationships and sequences, making the whole process far less of a cognitive lift.
Clarity
Text-based approaches often suffer a stunning lack of clarity. Text is slippery. Words have multiple meanings, assumptions get baked in, and what's crystal clear to the author can be opaque to everyone else. "Ensure timely follow-up." What's timely? An hour? A day? Before the next Ice Age? This ambiguity is where tasks go to die.
A visual workflow, with its explicit boxes, arrows, and decision diamonds, forces a certain level of unambiguous precision. Using a visual map to define roles and responsibilities, similar to a RACI chart, eliminates confusion. It's much harder to creatively interpret a directional arrow than a loosely worded sentence. You can literally see the intended path, reducing the "Wait, what am I supposed to do with this now?" moments.
Issue spotting
Trying to find a bottleneck, a redundant step, or a gaping hole in a process described purely in text is like playing Where's Waldo? on a transcription of a Pollock painting. You might stumble upon it eventually—a form of accidental gap analysis—but it's hardly efficient.
A visual workflow lays it all out. That step where five arrows converge before a single person's review box? That's probably a bottleneck. That loop that seems to go nowhere? That's a problem. The visual representation makes these structural flaws almost impossible to ignore.
Communication
With text-based or tribal knowledge workflows, you often end up with as many versions of the process as there are people on the team. Everyone has their own mental model, their own little tweaks and interpretations. It's a communication nightmare that leads to inconsistent outcomes and endless meetings to "realign."
A visual workflow acts as a single, shared point of reference, almost like a communication plan for your process. When everyone is looking at the same diagram and discussing the same boxes and arrows, you dramatically reduce the chances of talking past each other. It becomes the agreed-upon map. I've literally seen arguments about "how things are done" instantly settled by projecting the visual workflow onto a screen. Hard to argue with the big picture when it's staring you in the face.
Here's a quick breakdown to make it a little clearer:
| The old way | The visual way |
|---|---|---|
Representation | Walls of text, easily outdated lists, "that's just how Bob does it" | Standardized diagrams, clear symbols, and visible connections |
Clarity | Often ambiguous, open to interpretation, riddled with assumptions | Aims for high intuition and explicitness |
Issue spotting | Difficult; bottlenecks, redundancies, and gaps hide in paragraphs | Easier; bottlenecks, loops, and dead ends are visually apparent |
Communication | Leads to varied interpretations and inconsistent execution | Creates a shared understanding and a single source of truth |
What are the benefits of a visual workflow?
I've wrestled with enough tangled processes to know that even a slightly better way of seeing things can make a massive difference.
A visual workflow can:
Improve clarity and understanding: Yes, I'm repeating myself, but it's foundational. When people actually get it, fewer mistakes happen.
Enhance communication and collaboration: It's easier to talk about something concrete. Pointing to a box on a chart and saying "this step seems to be the holdup" is far more productive than vague complaints. This level of clear communication is one of the most important soft skills a team can have, and visual workflows facilitate it.
Increase efficiency: When you visualize the flow, you often spot the scenic routes your process has been taking. I once helped a team cut their client intake time by a solid 20% just by mapping it and axing two redundant information requests.
Spot bottlenecks easier: Visuals are cruel to bottlenecks—they expose them mercilessly. That column on your Kanban board that looks like a traffic jam on a holiday weekend? That's your problem child, right there in plain sight.
Improve problem-solving: When things go sideways (and they will), a visual map is your first diagnostic tool. You can trace the steps to figure out why without a lengthy inquisition, sometimes using the map as a simplified fishbone diagram to find the root cause.
Streamline training and onboarding: Handing a new hire a clear flowchart of their core responsibilities is an act of kindness. They can see the flow, understand dependencies, and feel less like they've been thrown into the deep end with a vague instruction manual.
Standardize processes: This is the core of business process management (BPM). Visual workflows help ensure everyone is paddling in the same direction and using the same method. This leads to more predictable outcomes and makes it easier to measure performance.
Support continuous improvement: You can't easily improve what you can't see and measure. A visual workflow is your baseline. Want to try a change? A key part of process optimization is modifying the diagram, testing it, and seeing if it works better. It becomes a living tool, not a static document.
Examples of visual workflows
Beyond theory, seeing visual workflows in action reveals their true value. They're highly versatile and apply across many business functions—often unexpectedly—to prevent operational meltdowns. Here are some common examples of how they work in practice.
Software development: Agile boards

Agile boards are designed to visualize the beautiful chaos of building software. They track sprints (those short, focused bursts of work), user stories (the often-optimistic tales of what users want), individual tasks, and the inevitable bugs that pop up like unwelcome party guests.
You'll typically see stages like:
Backlog
Selected for development
In development
Testing/QA
Deployed
It's about transparency and keeping everyone rowing in roughly the same direction. There's a certain grim satisfaction in dragging a particularly thorny bug card to the "Done" column that few other professions can replicate.
Project management: Kanban boards
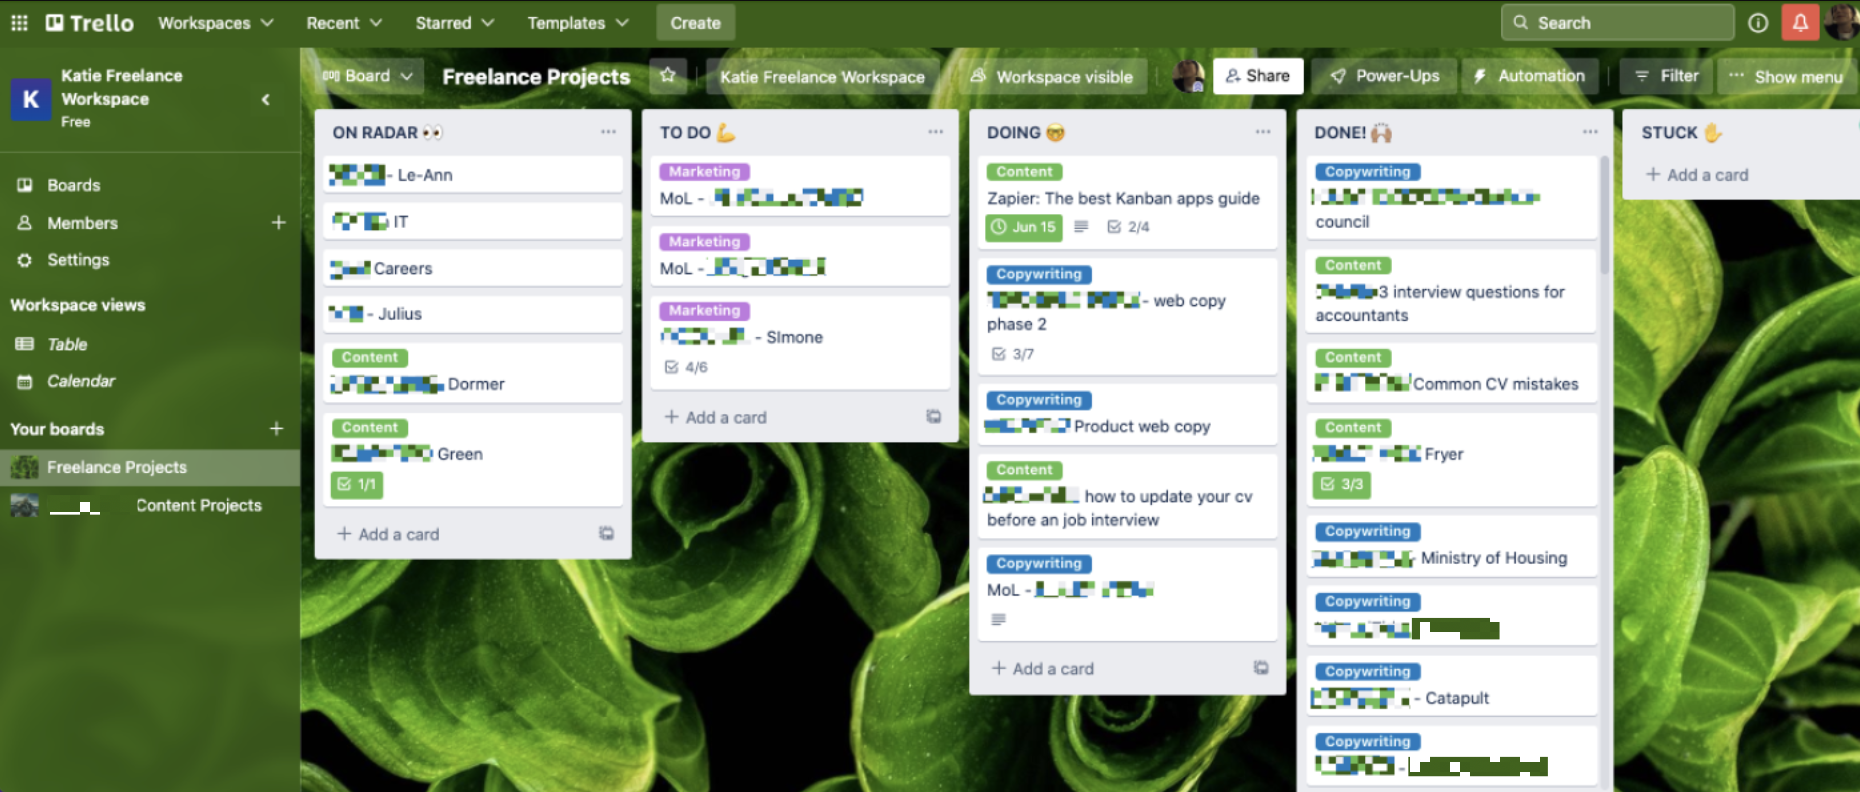
Kanban boards are a fantastic visual workflow option for general project management. If your project currently resembles a room full of startled cats, a Kanban board is your attempt to gently guide them into some semblance of order.
You visually organize tasks into columns representing stages of a project. Classic columns are "To do," "In progress," and "Done," but you can—and absolutely should—customize these to fit your actual process. Think: "Idea inbox," "Researching," "Needs review," "Approved," and "Launched."
Tasks are represented as cards. These cards then move from left to right across the columns. This simple act provides a surprisingly clear, real-time view of who's doing what, how much work is swamping a particular stage (hello, "Needs review" column with 37 cards), and where your progress is hitting a wall.
Trust me on this one: implementing WIP limits—like saying "no more than three tasks in this column at once"—can be a lifesaver. It forces you to finish things instead of just starting more.
Marketing campaigns: Campaign flowcharts

Launching a marketing campaign is a major undertaking, but with more glitter and existential dread about ROI. A campaign flowchart can be your strategic map. It helps you chart out the various stages, decision points, and marketing channels you'll be using.
This is where swimlanes can be your best friend. By dividing the flowchart into horizontal lanes, you can clearly assign responsibilities to different teams, like "Content, "Design," and "Legal review." It helps avoid that delightful scenario where everyone assumes someone else is handling a critical piece.
Sales pipelines: Funnel or stage-based diagrams

For anyone in sales, your pipeline is your lifeblood, and visualizing it is crucial. These often look like a funnel or a series of connected stages. The goal is to visually represent the journey of a lead, from that first tentative "Hello?" all the way to a triumphant "Closed won."
Typical stages you'll see mapped out include "Initial contact," "Qualification," "Proposal sent," and "Negotiation." Seeing this visually doesn't just make your CRM data look prettier; it gives you immediate, actionable insights for your entire lead management strategy. Is there a massive clog in the "Proposal sent" stage? Maybe your proposals are too complex, or your follow-up needs work. It's a surprisingly effective way to spot where deals are stalling.
Customer onboarding: Process maps

You've made the sale. High-fives all around. Now comes the arguably more important part: making sure your new customer doesn't immediately regret their decision. A customer onboarding process map visually outlines this entire journey, step by painstaking step.
A proper onboarding map orchestrates all the moving parts beyond just a simple welcome email. It starts with the administrative necessities, clearly assigning who's responsible for finalizing legal documents and planning for the financial element to sort out billing. From there, it moves to the crucial handoff phase: a proper welcome for the client, establishing communication channels, and clarifying how you'll handle file sharing. It also ensures nothing gets dropped by outlining how and when to schedule routine follow-ups.
Mapping this entire customer journey helps you avoid being the company that provides a confusing, frustrating experience from day one.
Content creation: Editorial workflow

Content creation is that magical process of turning caffeine and vague ideas into sparkling prose. An editorial workflow can bring some much-needed sanity to this often chaotic endeavor. It visualizes the stages of content production, from topic ideation through outlining, the actual creation, editing, SEO review, design, that nail-biting final approval, and finally, hitting "publish" and sending out those first outreach emails.
Seeing this laid out helps everyone on the team understand where a piece of content is, what's coming next, and who's holding things up (gently, of course).
Automation workflows: Charting a course for your robot helpers
Finally, let's talk about a type of workflow where the diagram isn't just a map for humans—it's the blueprint for the robots. An automation workflow is a process designed for software to execute without you needing to press a button each time. This is the heart of workflow orchestration and no-code automation.
Using a visual workflow builder, you can create an entire automated system that visualizes your workflow.
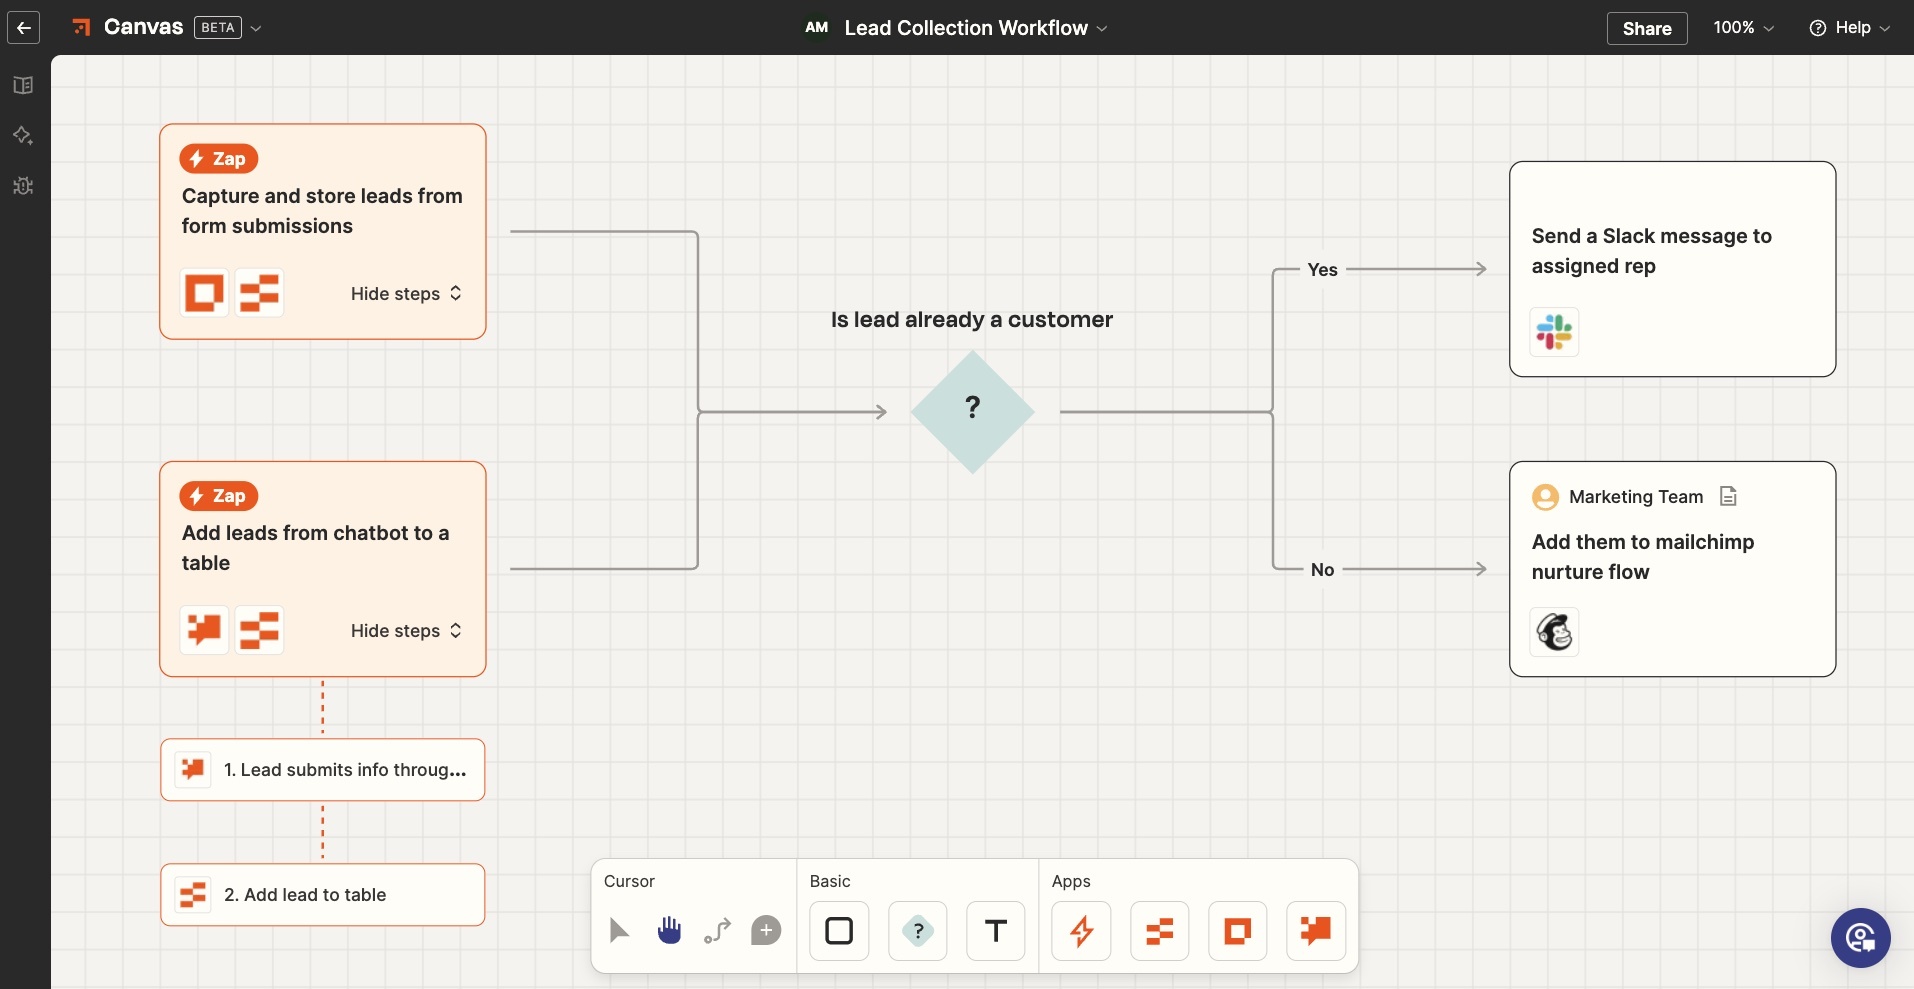
You're not just mapping what should happen; you're literally connecting apps, setting the rules, and pressing play. For example, imagine you want to automate the initial steps of your lead management. The visual workflow, as depicted in the image above, might function like this:
Trigger: A new lead is captured, when someone submits a lead capture form on your website or provides their details through a chatbot.
Action: This new lead's information is automatically sent to your designated data storage system, such as your CRM or a database, ensuring it's recorded securely.
Action: Immediately after the data is stored, a notification is automatically dispatched to the relevant sales representative, alerting them to the new lead so they can begin their follow-up.
You drag, drop, and connect these modules visually. The diagram is the machine. It's the ultimate evolution of a visual workflow—one that not only shows the process but actively carries it out.
Tools to help you create visual workflows
Alright, you're ready to start mapping, but picking a tool can feel like wading through a sea of suspiciously similar-looking logos. The key isn't to find one single app that does everything, but to understand the types of tools at your disposal and know which one to grab for the right stage of your process.
Collaborative online whiteboards and mind mapping software
Collaborative online whiteboards, like Miro or Mural, are the digital equivalent of a massive wall, a pack of Sharpies, and a pile of sticky notes—ideal for the messy, creative, and collaborative beginning of a process. It's less about formal structure and more about brainstorming, mind mapping, and getting all the ideas out in one place before trying to wrangle them into order.
For more options to create your visual workflows, take a look at Zapier's picks:
Flowchart and diagraming software
These are your specialists, the architects of the workflow world, purpose-built for creating clean, formal process maps, flowcharts, and other structured diagrams. When clarity and precision are paramount for complex processes, dedicated tools like Lucidchart or Microsoft Visio are go-to choices.
Here are some more options:
Project management tools
If diagramming apps are for designing the blueprint, project management tools are for building the house and bringing those visual plans to life. Platforms like Asana, monday.com, and Trello help you assign tasks, track progress, and manage timelines, often with their own built-in visual features like Kanban boards, timelines, and Gantt charts.
Here are Zapier's picks to get you started:
Marketing and sales
For both marketing and sales teams, specialized software is crucial for visualizing and managing their distinct workflows. Marketing automation software allows you to map out customer journeys, email sequences, and campaign flows, making it easy to see where leads are coming from and how they're progressing through your funnels. Similarly, pipeline management software (often integrated into CRMs) provides a clear visual representation of your sales process, from initial contact to closed deals, helping sales teams identify bottlenecks and prioritize follow-ups. These tools are specifically designed to make complex customer-facing processes transparent and actionable.
Here are some top choices:
Visual automation builders
Visual automation builders represent a powerful evolution. Here, you're not just mapping a process; you're building a blueprint that software can execute.
With Zapier Canvas, you'll build a visual workflow, which can then actually execute the tasks at hand. This means your visual workflow doesn't just sit there as a reference—it actively runs your processes, connecting tools and moving data without requiring manual intervention each time.
You can even use AI to help build your visual workflow using natural language and add AI into the steps of your workflows, too—a full AI orchestration experience.
Automate your visual workflows with Zapier
Turning a tangled process into a clear diagram takes effort, but the alternative—operating in a fog of assumptions and missed steps—is far more painful in the long run. A visual workflow is your best weapon against that chaos. It's the first, most critical step toward making your processes not just visible, but better.
Once you've mapped your workflow, Zapier can automate the steps by connecting the apps you use every day to automatically execute the tasks you've visualized. Zapier's AI orchestration platform can help you accelerate ops with intelligent workflows and let you build custom solutions that grow with your needs. Not sure where to start? Read more about Zapier Canvas.
Related reading:
