You can pull data on just about anything: stock performance, customer satisfaction levels, Google Search trends, and—my personal favorite—how many squirrels are running through New York City parks. You name it; you can measure it.
Often, this valuable data gets buried in a wall of text, mundane charts, or spreadsheets running thousands of rows deep, making it nearly impossible to understand just how many squirrels are running around the city (or whatever else you're interested in).
To get the most out of your data, you need to make it shine. Here's how to use Claude Artifacts to visualize data.
Note: This article assumes you know the basics of how to use Artifacts. If you need a refresher, check out this step-by-step guide: How to use Claude Artifacts.
How to use Claude Artifacts to visualize data
Here's a summary of how to use Claude Artifacts to create data visualizations (keep scrolling for detailed steps with screenshots):
Prepare your data and export it.
Go to claude.ai, and log in.
Upload your file and ask Claude to create a data visualization of it.
Once Claude outputs an Artifact, you have a number of options:
Edit your Artifact.
Download your Artifact to use in other projects.
Share your Artifact.
Now for the details.
Prepare your data and export it
Before Claude can transform your data into a visual wonder, you first need to provide it with clean, well-structured data.
Review your data while asking yourself these questions:
Are there any text variables that need to be converted to numerical data?
Are there any categorical variables that might be coded into categories inconsistently?
Are there any variables that need to be expanded into multiple categories?
Are there any variables where creating categories might be useful?
Is standardization necessary for any of the variables (for example, converting dates to a specific date format)?
Are there duplicates or missing data that need to be fixed?
Are there any outliers that might be errors?
Once you've cleaned up your data, export it as a CSV file. Note: Claude supports common file types, including PDF, HTML, and DOCX, up to 30MB per file. You can also upload an image of a chart and ask Claude to create a visualization. But in my experience, Claude works best with CSV files for data visualizations.
Log in to Claude
Go to claude.ai, and log in to your account.

Don't have an account yet? You can create one for free using your Google account or an email address.
Ask Claude to create a data visualization
Upload the CSV file to your chat. The easiest way to do this is by dragging and dropping the file from your hard drive into the message bar.
For your prompt, write "Create a [visualization type] for the attached data. [Include any additional criteria you want the tool to follow.]"
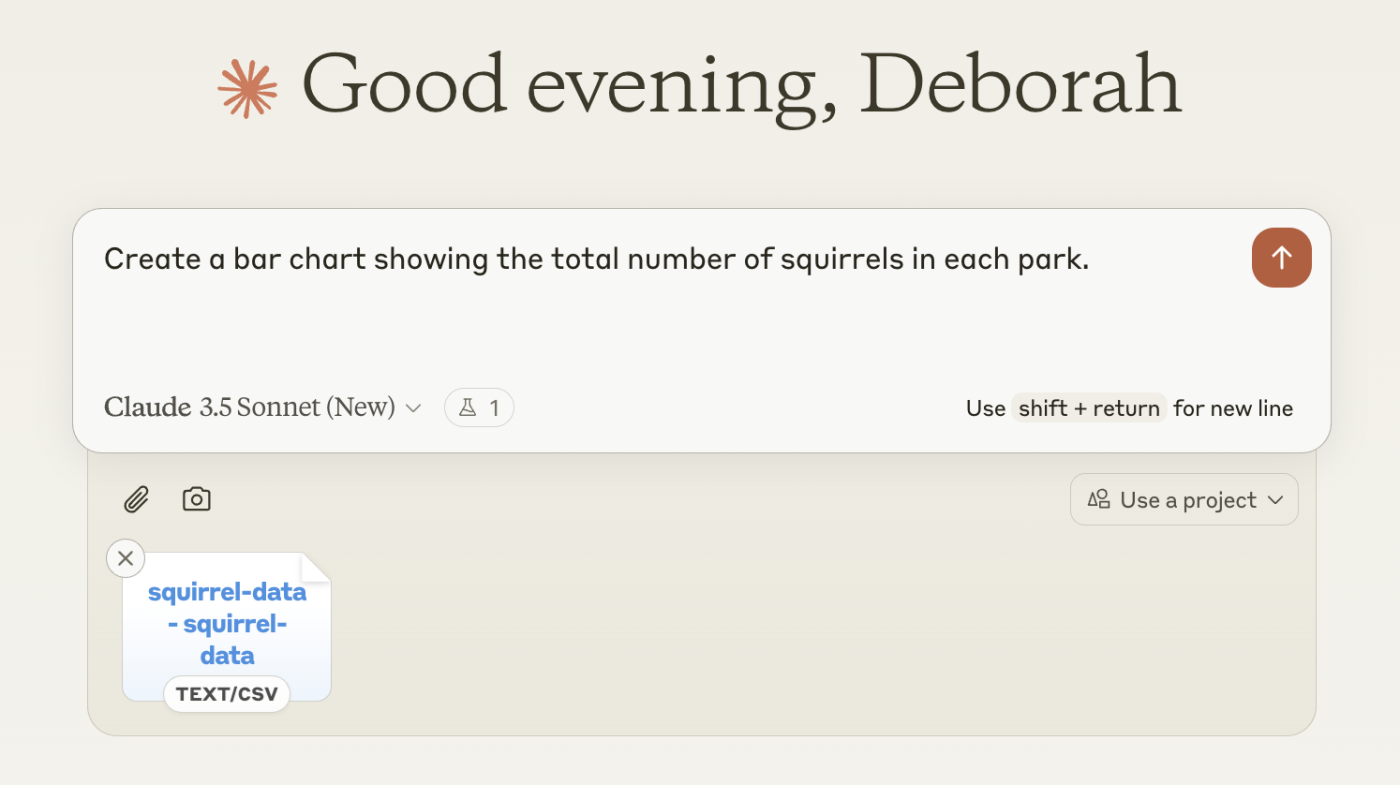
Press Enter or return, or click the up-facing arrow to submit your prompt.

In a matter of moments, Claude will output an Artifact containing your data visualization. Claude tends to default to creating simple bar graphs. But you can prompt it to output plenty of other types of visualizations, including multi-series line charts, pie charts, scatter plots, and TreeMaps.

You can also interact with the visualization in your Artifact by hovering over various elements to get more details. Want to add more information on hover or click? Ask Claude to update the tooltip to show whatever details you'd prefer.

It's worth noting one key limitation here: Claude tends to hallucinate when working with large datasets or if you ask it to add too many filters or layers. Once it starts down this glitchy path, it tends to double down on its hallucinations. So, if you're having trouble, I recommend starting a new chat altogether.
Share your data visualizations
Once you have created your data visualizations, you have two options for sharing it.

Download the Artifact. Click the Download to file icon, which looks like an arrow pointing down into a box. It'll download as a .tsx (TypeScript) file to your hard drive. From there, you can integrate it into your own React projects or further customize the code if needed.
Publish the Artifact. Click Publish to share your Artifact with anyone on the internet (your chat will remain private). In the popup that appears, click Publish & Copy Link, and share your link as you normally would.
Automate Anthropic
Creating data visualizations is just one of the many ways Claude can help you distill large amounts of information into digestible bits. When you use Zapier to connect Claude with the rest of your apps, you unlock thousands more possibilities to redesign your workflows. For example, you can automatically send Claude-generated summaries of action items from meeting minutes to your project management app. Or get Claude to analyze form responses stored in your survey app.
Learn more about how to automate Claude with Zapier, or get started with one of these pre-made templates.
Write AI-generated email responses with Claude and store in Gmail
Generate an AI-analysis of Google Form responses and store in Google Sheets
Zapier is the most connected AI orchestration platform—integrating with thousands of apps from partners like Google, Salesforce, and Microsoft. Use interfaces, data tables, and logic to build secure, automated, AI-powered systems for your business-critical workflows across your organization's technology stack. Learn more.
Related reading: