When you're managing a project that spans weeks or months, sometimes you need to visualize things over time rather than as a list of tasks. Gantt charts help you look at a project's most important components, giving you a convenient way to get an automatic overview of your projects, tasks, and deadlines—and ensuring everything runs smoothly along the way.
Along with Kanban boards, Gantt charts are one of the most prevalent management tools out there. And, since most modern Gantt chart software integrates easily with the rest of your work tools you can reap all the benefits of Gantt charts, while using technology—including automation with Zapier—to do a lot of the hard work.
What is a Gantt chart?
Upon first glance, a Gantt chart looks like an ordinary horizontal bar chart. When you look closer, you'll see it's actually full of information about your project schedule. You can see project names, deadlines, and milestones, as well as associated tasks, resources, and dependencies. The project's work breakdown structure is clearly displayed or illustrated within the chart.
Whether you're the one scheduling the project or a contributor who needs to see what's been planned for you, chances are you'll run into a Gantt chart at some point.
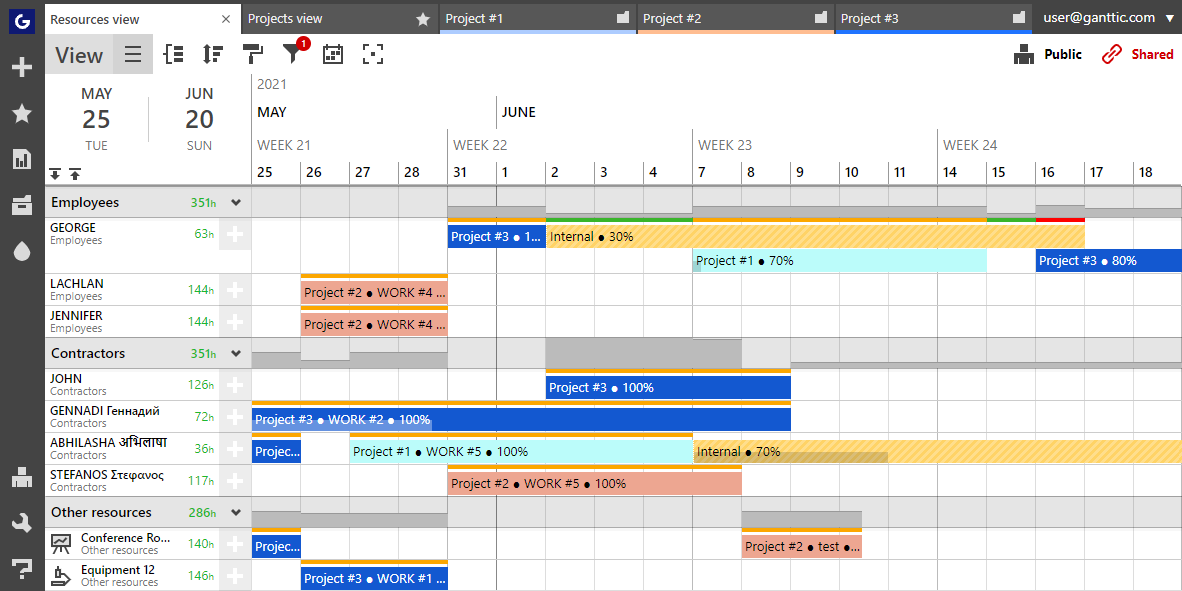
Table of contents
Who uses Gantt charts?
Developed by engineer Henry Gantt over 100 years ago, the eponymous charts break down even the most complex data into an accessible and actionable plan making them a perennial favorite of managers and project managers.
Early adopters used the charts in the construction of the Hoover Dam. Now, you can find them in use by software developers, event planners, in design, manufacturing, and more.
Not only are they adaptable to any industry, they are also able to conform to any project management methodology. You can even combine them with other tools such as Kanban boards. This versatility has helped Gantt charts become a staple of most modern project management software.
Elements of a Gantt chart
Gantt charts work so well because most of a project's core components are visual. And presenting things visually means you don’t have to scrutinize your project data in order to make sense of it. Here are some of the most important elements you'll find in a standard Gantt chart:
Timeline and dates: What the tasks are measured against. You can think of this as the backbone of your project. From the timeline, you can see how your work activities are progressing as well as the start and end dates. Newer versions of Gantt charts allow you to zoom in and out of the timeline, making it easier to pinpoint exact dates for more accurate short and long-term planning.
Project taskbars: How your project is represented in the chart. With Gantt charts, the project's tasks are shown by horizontal bars, so you can see what tasks belong to which projects and the length of time allotted for each to be completed.
Dependencies: How your tasks relate to one another. Dependencies show which tasks need to be done first in order to begin the next part. Often depicted with little arrows, they further demonstrate the work breakdown structure of the project.
Resources: The people, tools, and equipment needed to carry out the project. Adding your resources ensures that no one is under- or over-worked and that you have the correct capacity for the duration of the project.
Milestones: These are the little wins of a project. You'll normally find milestones at the end of a task or phase. But they can be anything that holds some significance for the project.
Automation advice: Milestones are important and should be celebrated! Create a Zap that automatically adds milestones to your team’s google calendar. Mark the occasion with a work gathering and toast your team’s hard work.
More details
Benefits of planning with a Gantt chart
There are more than a few advantages to choosing a Gantt chart for your project planning. For starters, you'll notice:
Improved visual overview: Humans are inherently visual learners. And Henry Gantt's charts are an ideal way to visualize workflows. A quick glance can communicate a project's tasks, dependencies, resources, and length. This makes it easy for project managers to report to stakeholders about the status of their projects. Plus, a bird's eye view allows for more accurate long-term planning.
More ergonomic project management: As previously mentioned, Gantt charts can be paired with any project management methodology as well as other work tools. If working with a specific piece of Gantt chart software isn't your cup of tea, do your planning in another work tool and use Zapier to connect—or vice versa. This helps keep the project data organized, but also lets project managers control how they plan.
Automation advice: Maybe Kanban is your preferred management tool. No problem. Here’s a way to add new cards to your Trello board automatically, when a new task is added to TeamGantt.
Better resource management: Not all Gantt charts include resources. But many do, and there’s a good reason. By seeing the resources needed for each task, managers can keep track of who is doing what, as well as who can take on more, and who's overbooked already. It makes it easy to reallocate resources and team members as needed which will help to smooth out potential project bottlenecks.
Real-time changes and agility: When they were first developed, the charts were hand-drawn. So whenever changes occurred, the whole chart needed to be remade. Luckily things have changed. Online Gantt charts make it easier to edit and adjust when the project hits a roadblock or when tasks need to be added. Instantaneous updates keep everyone in the loop and ensure agility.
Automation advice: Set up a Zap that links your Gmail to Clickup. Your Gantt chart will update instantly when new emails come in.
See how plans fit together: Project management is messy. With so many different components working together, it can be hard to keep track of everything—and even harder to see the big picture. But Gantt charts easily lay out all related tasks, as well as their timeframes. That allows project managers, stakeholders, or team members to see what's been accomplished and simultaneously see what still needs to be done. The charts add transparency to the project plans and ensure that nothing gets overlooked in the process.
Steps to planning a project with a Gantt chart
However you wish to produce your chart, there's a set of basic steps you'll need to follow. We’ve outlined them below and included a few ways that adding automation can speed up the process.
1. Create a project: Start with your project. What's the goal and timeframe? Perhaps you already have an end date in sight. Or maybe that's what you need to figure out with the next steps.
Automation advice: By integrating your calendar app with your Gantt chart you can create automated workflows to automatically update when changes occur, for example, automatically adding a task to your Gantt chart for a new calendar event or a calendar event to block off time to work on a new task.
2. Define tasks and subtasks: What are the components of the project? How will you reach those goals? Tasks are the activities that go into the project and you'll need to break them down in order to complete the project's objectives.
Automation advice: Want to see your Gantt chart's tasks in another app? Create a Zap that adds new tasks to Todoist when you add one in ClickUp.
3. Select start and end dates: If you don't have an end date for the project, you can estimate it via its tasks. Once you've figured out the timeframe, you can add the projects and tasks to the actual chart. It will then provide a visual representation of not only the project’s components, but also its timeline.
Automation advice: If you’re used to planning tasks with spreadsheets, you can use Zapier to connect tools like Asana with programs like Google Sheets or Excel so that any time you add a new row to your worksheet, a new task is added in Asana.
More details
4. Add dependencies: Now you can begin figuring out the order of tasks. On a Gantt chart, the order in which tasks should be completed are often represented by arrows. It's also important to remember to account for lag times between dependencies, in case of any delays.
5. Pinpoint milestones: These are the project's checkpoints. As such they may not be confined to a specific time, so much as to a specific achievement. Although milestones aren’t a necessity, they do help to improve morale and productivity. Because who doesn't want a little recognition for their hard work? Milestones also ensure that the project is on track and can be a helpful litmus test for how well the project was planned.
6. Allocate resources and ownership: Who and what will actually bring the tasks and projects to completion? By assigning ownership, you not only ensure that the tasks get done, but that no one is over or underutilized in the process. Effectively putting an end to employee burnout. As well as preventing hiccups and delays that come from not being sure who is working on what.
Automation advice: With Zapier, you can create a trigger that alerts when changes are made to the Gantt chart's resources in everyday work tools such as Slack. For example, if you add a resource to the Gantt chart in Ganttic, the team will be automatically messaged in Slack. That way your team members will know immediately if their schedules are updated.
7. Add other necessary data: In addition to a project's resources, some Gantt chart software allows you to add supplementary data. Budgets, your team’s time zones, the site of a task, a pdf file—anything that might be relevant to your project's success. In traditional Gantt charts, it would be too messy to include this kind of data, but with modern, online charts, all of this is possible. And can be incredibly useful depending on your planning needs.
Automation advice: Link Easy Projects with FreshBooks to add budgeting info to projects.
8. Monitor and modify: Finally the project is planned, but the work is far from finished. Now the project manager needs to keep a close eye on both the Gantt chart as well as those carrying out the project, adjusting the plans as the work progresses.
Maybe a piece of equipment will break down that will set back the start date. Or perhaps the team will take on another project that takes precedence. There could be changes in funding. Or maybe the client will change their mind?
Change is inevitable, but luckily modern-day Gantt charts don't require that you start from scratch. Make the adjustments as necessary and keep your team up to date.
Automation advice: Need to make updates on the go? Slack integrates with tons of project management software, letting you update your Gantt chart from anywhere.
Use Gantt charts to your advantage
Gantt charts are an easy way to visualize project plans, monitor progress, and predict future capacity. Using them in conjunction with Zapier means managers have more control over how plans are made. And teams can easily stay up to date with the changes. By leveraging your tools to better fit your workflow, you can be more productive with less effort.
And when you add automation, you're able to keep things on track with less effort. Here are a few examples of some Gantt-chart capable software you can use with Zapier.
This was a guest post from Amanda Haynes, marketing manager at Ganttic. Ganttic is an online resourcing tool that helps people create their own more efficient worlds. Want to see your work on the Zapier blog? Check out our guidelines and get in touch.
Related reading: